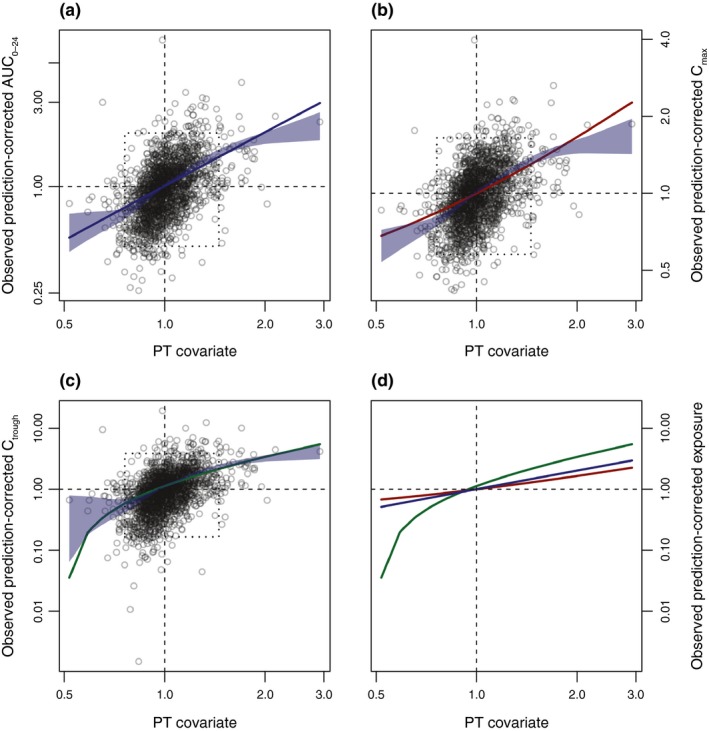
Figure 2.

Derivation of the PT‐adjustment function. Relationship between the PT covariate and observed prediction‐corrected exposure estimates for (a) AUC 0–24, (b) Cmax, and (c) Ctrough. (d) Comparison of the linear PT‐adjustment functions for AUC 0–24, Cmax, and Ctrough. Blue shading shows the 95% confidence bound for the locally estimated scatterplot smoothing regression. Dotted boxes highlight areas where 95% of the data are located. Solid colored lines show the respective estimated linear relationship. AUC 0–24, area under the plasma concentration–time curve over 24 hours; Cmax, maximum concentration; Ctrough, trough concentration at the end of the dosing interval before the next dose; PT, prothrombin time.
