
Figure 2.
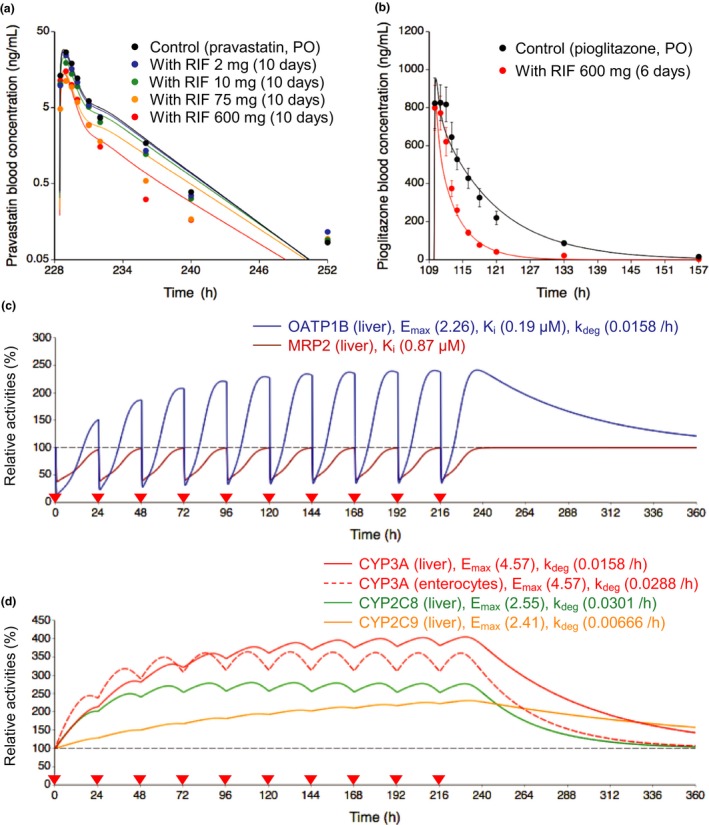
Optimized and observed blood concentration‐time profiles of pravastatin and pioglitazone before and after repeated oral dosing of rifampicin and relative activities of OATP1B, MRP2, and CYP isoforms in the liver or intestine during rifampicin treatment. (a,b) Solid lines and closed circles represent optimized and observed blood concentration‐time profiles, respectively. (a) Blood pravastatin profiles after a single oral dose of 20 mg pravastatin before (black) and after repeated oral dosing of 2 mg (blue), 10 mg (green), 75 mg (orange), and 600 mg (red) rifampicin once daily for 10 days.6 (b) Blood pioglitazone profiles after a single oral dose of 30 mg pioglitazone before (black) and after (red) repeated oral dosing of 600 mg rifampicin once daily for 6 days.16 Observed blood concentrations were shown as mean ± SD. (c,d) Solid lines represent predicted time profiles of the relative activities of OATP1B (blue), MRP2 (brown), CYP3A (red), CYP2C8 (green), and CYP2C9 (orange) in the first liver compartment during repeated oral dosing of 600 mg rifampicin. The OATP1B activities were predicted considering both induction and inhibition effects of rifampicin. The MRP2 activities were predicted considering inhibition effect of rifampicin. The CYP activities were predicted considering induction effects of rifampicin. The red dashed line represents predicted time profiles of the relative activities of CYP3A in the enterocyte compartment. The values of Emax, K i, and k deg for each transporter and CYP isoform are indicated on the figures. Black dashed horizontal line represents unity. The red closed inverted triangles represent the timing of rifampicin dosing. CYP, cytochrome P450; Emax, maximum induction effect; k deg, degradation rate constant; K i, inhibition constant; MRP2, multidrug resistance protein 2; OATP1B, organic anion transporting polypeptide 1B; PO, oral dose; RIF, rifampicin.