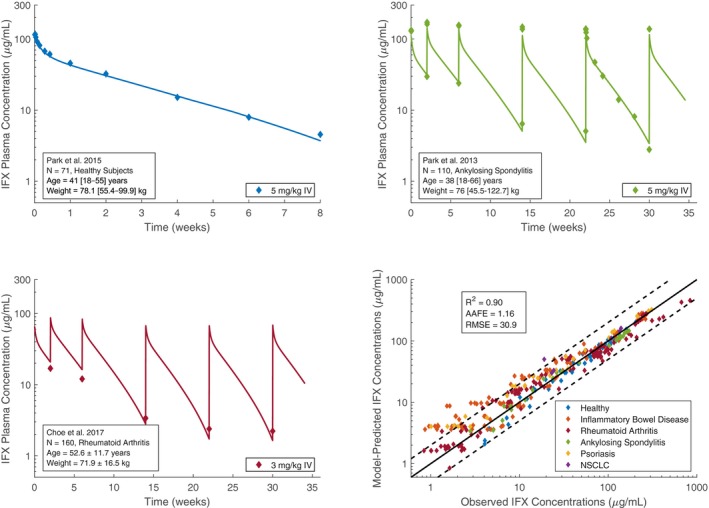
Figure 1.

Sample infliximab pharmacokinetic profiles in healthy subjects, ankylosing spondylitis, and rheumatoid arthritis, and a comparison of model‐predicted vs. observed infliximab concentrations. References to observed data provided in Table S1 . AAFE, absolute average fold error; IFX, infliximab; NSCLC, non‐small cell lung cancer; R 2, squared Pearson correlation coefficient; RMSE, root mean squared error.
