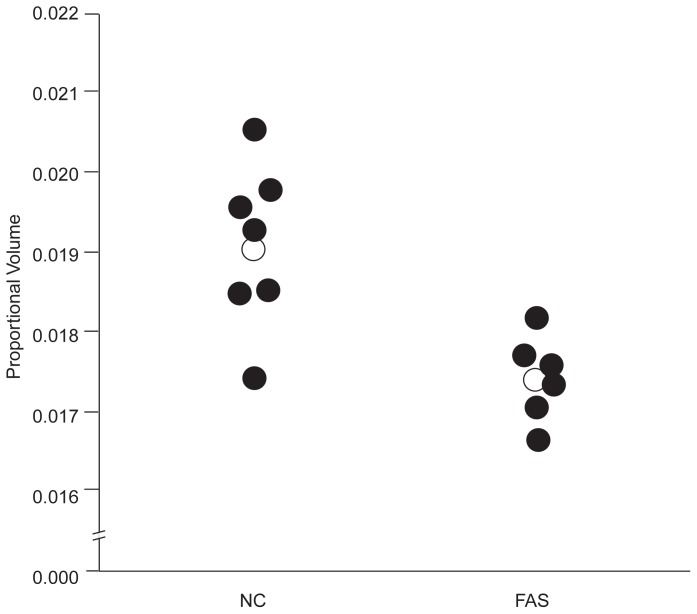
Figure 2.
Graph depicting the proportional volumes of the basal ganglia of six children with fetal alcohol syndrome (FAS) and seven normal control children (NC). Each circle represents one child, and the open circles represent the group average. The children with FAS show a reduction in ganglia volume.

