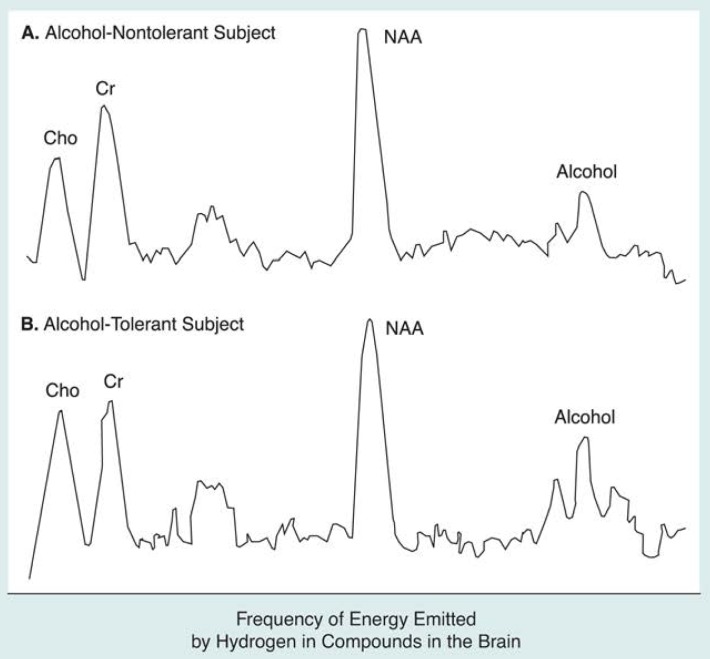
Figure 6.
Hydrogen magnetic resonance spectra from (A) an alcohol-nontolerant and (B) an alcohol-tolerant subject demonstrate that less alcohol may be bound to brain cell membranes in people tolerant to alcohol’s effects. Signals (i.e., peaks) from the three major brain metabolites (i.e., Cho,1 Cr2 and NAA3) appear similar between the two spectra, but the alcohol signal in the nontolerant subject is smaller. Both spectra were obtained at similar BAC’s4 and at similar times after the subjects consumed alcohol. However, the brain alcohol concentrations represented by these spectra are 26 percent of BAC’s in the nontolerant subject and 52 percent of BAC’s in the tolerant subject. Because research indicates that both blood and brain alcohol concentrations are equivalent, the remaining alcohol in these subjects’ brains is “invisible” to MRS.5 The invisible portion, which is larger in the nontolerant subject, is the alcohol pool believed to be bound to brain cell membranes.
1Cho = choline-containing compounds; 2Cr = creatinine-containing compounds; 3NAA = N-acetyl-aspartate; 4BAC’s = blood alcohol concentrations; 5MRS = magnetic resonance spectroscopy.
SOURCE: Adapted from Chiu et al. 1994.

