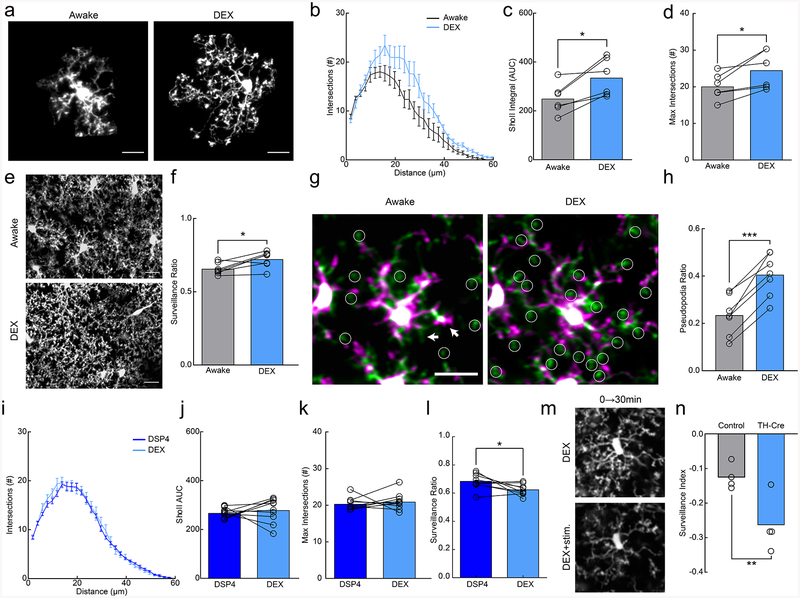
Figure 2|. Microglial surveillance is enhanced by dexmedetomidine.
(a) Example microglia in awake or dexmedetomidine-anesthetized (DEX) mice. (b) Sholl profile of microglia in awake (black) and DEX (blue); note increased ramification of microglial arbor with DEX (n=7 mice, 3–5 microglia per mouse). (c) Microglia in DEX-treated mice have a greater area under the curve (AUC) compared to those in awake mice (n=7 mice,, two-sided paired t-test, p=0.015, t(5)=3.63) and (d) a greater number of maximum process intersections (n=7 mice, two-sided paired t-test, p=0.024, t(6)=3.20). (e) 2D max-projection of microglial processes over an hour of imaging to quantify process surveillance. (f) Microglia in DEX-treated mice survey a greater portion of the CNS parenchyma (n=7 mice, two sided paired t-test, p=0.020, t(5)=3.13). (g) Overlays of two time points taken 10 minutes apart in awake and DEX-treated mice. Notice the increase in the extension (green) of pseudopodia (circles) after DEX. Arrows indicate filopodial extension (green) and retraction (magenta) in the awake state. (h) Quantification of the pseudopodia ratio showing a higher proportion of pseudopodia in DEX-treated animals (n=7 mice, two-sided paired t-test, p=0.00010, t(6)=9.01). (i) Sholl profile of DSP4-treated animals when awake (dark blue) and under DEX (light blue, n=10 mice, 3–5 microglia per mouse). (j) Sholl AUC shows no difference between awake and DEX-treatment in DSP4-treated mice (n=10 mice, two-sided paired t-test, p=0.55, t(9)=0.63). (k) There was also no significant difference in the maximum process intersections (n=10 mice, two-sided paired t-test, p=0.50, t(9)=0.69). (l) DSP4-treated mice had decreased surveillance ratio with DEX-treatment (n=9 mice, two-sided paired t-test, p=0.038, t(8)=2.48). (m) 2D max-projection of microglial processes over 30 minutes in DEX-treated mice before and after optogenetic stimulation of locus coeruleus (LC) axons in the cortex. (n) Stimulation decreased the microglial surveillance index (laser stim surveillance - baseline surveillance/baseline surveillance) to a larger degree in TH-Cre+ than light-control CX3CR1GFP/+ mice (n=4 mice, two-sided t-test, p=0.022, t(6)=3.08). Scale bars = 20μm. Graphs show mean±SEM; *p<0.05, **p<0.01, ***p<0.005. Points represent individual animals. See Supplementary Table 1 for the number of females and males used in these experiments.

