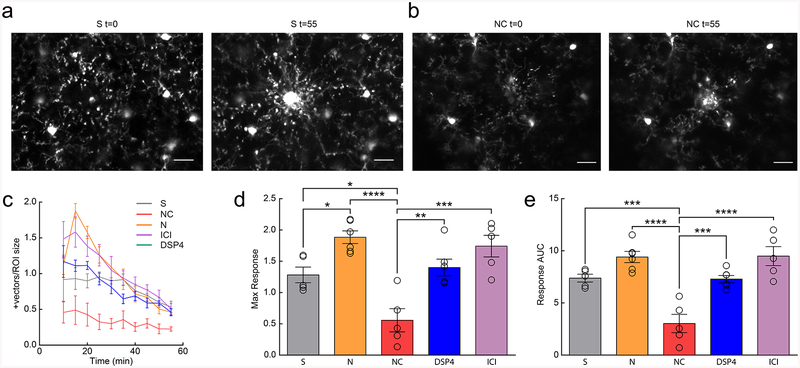
Figure 5|. β2AR activation inhibits microglial process response to focal tissue injury.
(a) Example microglial response to focal laser ablation in a saline-treated (S) mouse at t=0 and t=55 minutes post-ablation. (b) Example microglial response to laser ablation in a nadolol/clenbuterol-treated (NC) mouse at t=0 and t=55 minutes post-ablation. (c) Microglial process response vectors from 10–55 minutes post-ablation (n: S=5, N=7, NC=5, DSP4=6, ICI=6 mice). (d) Microglia in NC-treated mice have a reduced maximum response to focal tissue injury (n: S=5, N=7, NC=5, DSP4=6, ICI=6 mice, one-way ANOVA, p=1.7×10⁻⁵, F(4,26)=12.69, Holm-Sidak multiple comparisons: S v. NC p=0.016, S v. N p=0.039, N v. NC p=1.3×10⁻⁵, NC v. DSP4 p=0.0031, and NC v. ICI p=0.00010). (e) Microglia in NC-treated mice have decreased response area under the curve (AUC) 10–55min post-ablation (n: S=5, N=7, NC=5, DSP4=6, ICI=6 mice, one-way ANOVA, p=2.1×10⁻⁶, F(4,26)=16.65, Holm-Sidak’s multiple comparisons: S v. NC p=0.00073, N v. NC p=3.1×10⁻⁶, NC v. DSP4 p=0.00061, and NC v. ICI p=4.5×10⁻⁶). Scale bars = 20μm. Graphs show mean±SEM. Abbreviations: S=saline, N=nadolol, NC=nadolol/clenbuterol, ICI=ICI-118,551, DSP4=N-(2-Chloroethyl)-N-ethyl-2-bromobenzylamine; *p<0.05, **p<0.01, ***p<0.005, ****p<0.0001). Points represent individual animals. See Supplementary Table 1 for the number of females and males used in these experiments.

