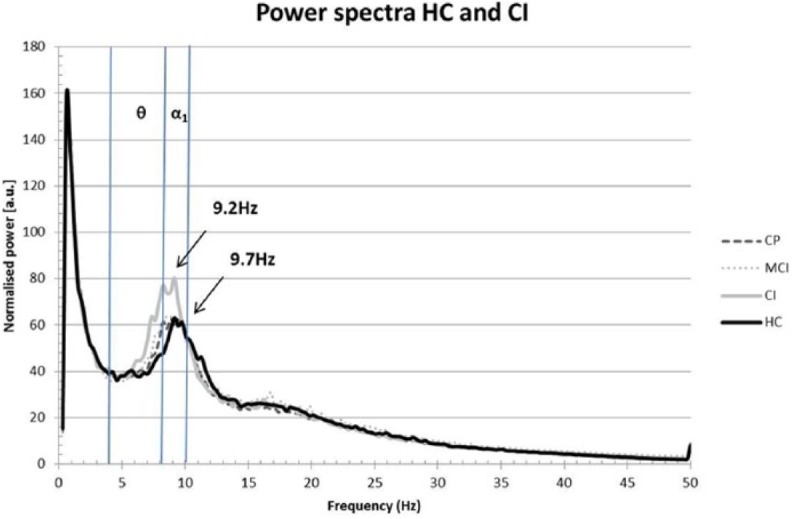
Figure 1.

Power spectra for the different cognition groups versus healthy controls.
CI patients had a significantly lower peak frequency (9.2 Hz, p = 0.019) than the HC group (9.7 Hz). The CP and MCI groups are added for reference and were not significantly different from any of the groups. The blue lines represent the thresholds for the significant frequency bands (the theta band ranges from 4–8 Hz and alpha1 band from 8–10 Hz).
