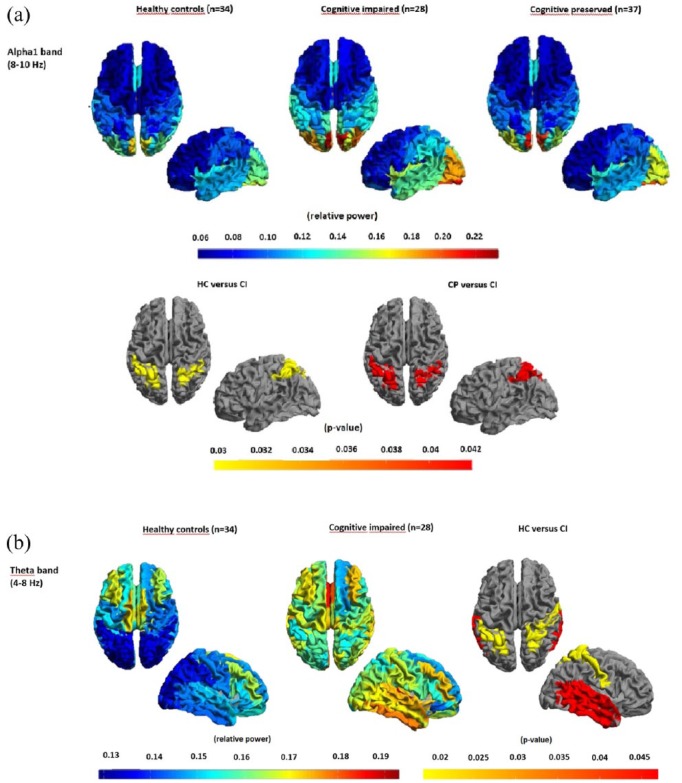
Figure 3.
Regional relative power and significant group differences.
Regional relative power and significant group differences displayed as color-coded maps on a parcellated template mesh: (a) alpha1 band (first and second row) and (b) theta band (third row). Note the significantly higher relative alpha1 power in the CI group versus HC, and versus CI. Note that for the theta band, the anterior–posterior gradient in the HC group is absent in the CI group and that the relative power for the CI group is significantly higher for several regions in the parietal and temporal cortices.

