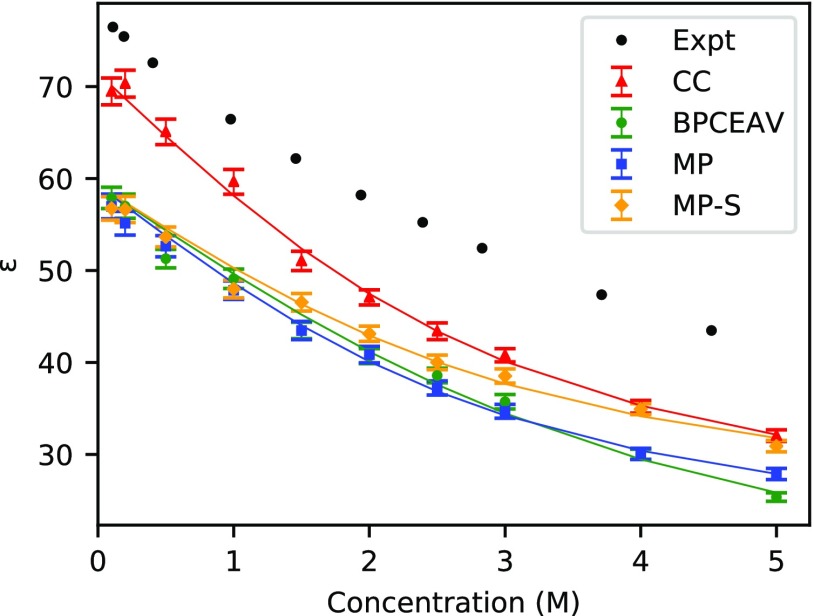
Figure 3.
Dielectric constant ϵ at 300 K as a function of salt concentration as obtained from the MD simulations with the CC, BPCEAV, MP, and MPS force fields (colored symbols) in comparison to the experimental data from60 (black symbols). The indicated errors ϵ obtained from the MD simulations have been obtained as described in the text. The solid lines (of same colors) are the result of fitting eq 6 to the corresponding data. The fit parameters are compiled in Table 2.

