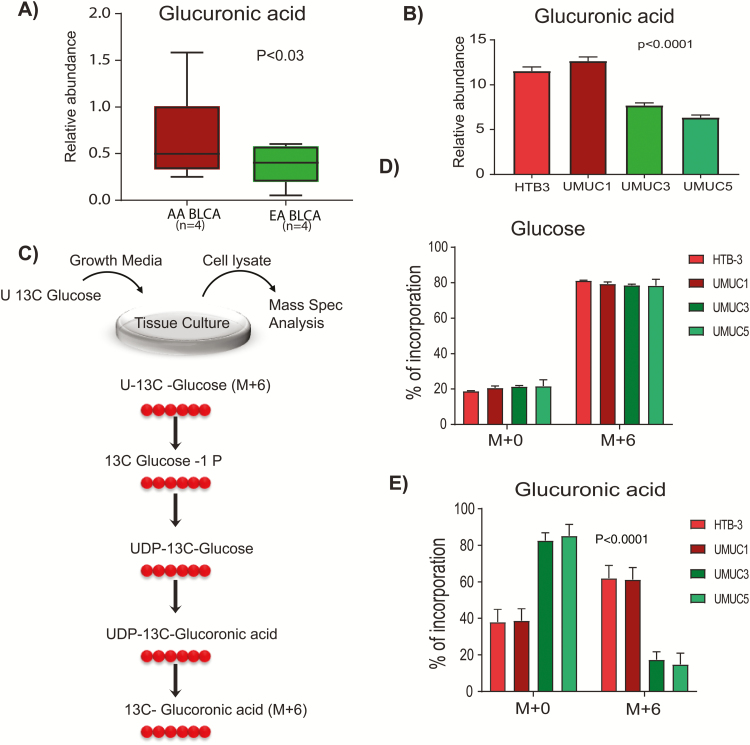
Figure 3.
Accumulation of glucuronic acid in AA and EA BLCA. (A) Measurement of glucuronic acid levels in ancestry-verified AA (n = 4) and EA (n = 4) BLCA patients measured by LC-MS/MS (P < 0.03, Student’s t-test, data represent mean ± standard deviation). (B) Measurement of glucuronic acid levels in ancestry-verified AA (HTB3 and UMUC1) and EA (UMUC3 and UMUC5) BLCA cell lines measured by LC-MS/MS (n = 3 biological replicates; P < 0.05, Student’s t-test, data represent mean ± standard deviation). Peak area was normalized using 13C-labeled internal standards to represent relative abundance level. (C) Measurement of labelled glucoronic acid (M+6) using 13C glucose. (D) Measurement of 13C glucose (M+0 represents unlabeled glucose, and M+6 represents all six carbon-labeled glucose). (E) Glucuronic acid levels (M+0 represent unlabeled glucuronic acid, and M+6 represent all six carbon-labeled glucuronic acid) in ancestry verified AA (HTB3 and UMUC1) and EA (UMUC3 and UMUC5) BLCA cells measured by LC-MS/MS (n = 4 biological replicates)..

