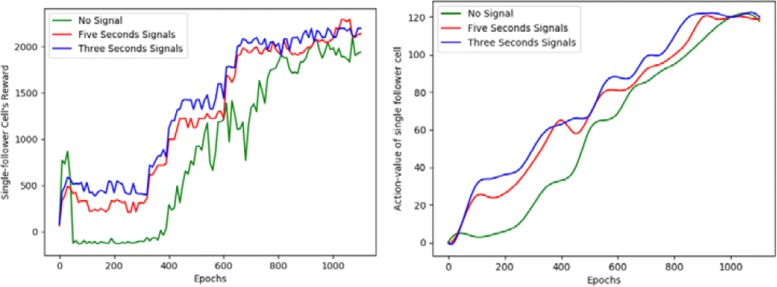
Fig. 3.
A quantitative behavioral representation of single follower cell. On the left, the abscissa is represented as the number of training, and the ordinate is expressed as the total rewards obtained by the agent. On the right side, the abscissa is also expressed as the number of training, and the ordinate represents the action-value of the agent. Among them, the green curve indicates that no stimulus signal is received, the red representative receives a stimulation signal every five seconds (It=5s), and the blue color indicates that the stimulation signal is received every three seconds(It=3s)

