
Fig. 3.
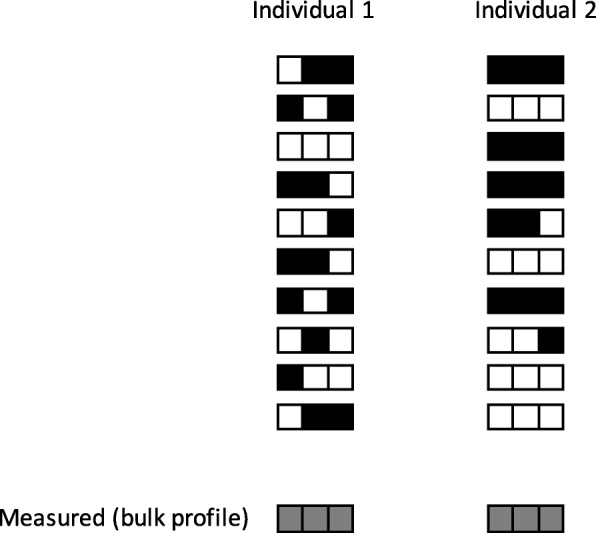
Single-cell analysis. Distinct cell variation in aging epigenetic clock changes may exist that would not be apparent in bulk comparison. Black and white squares represent methylated and unmethylated loci, respectively. Each row represents a single cell’s epigenome (represented as haploid for simplicity) with increased variability present in individual 2