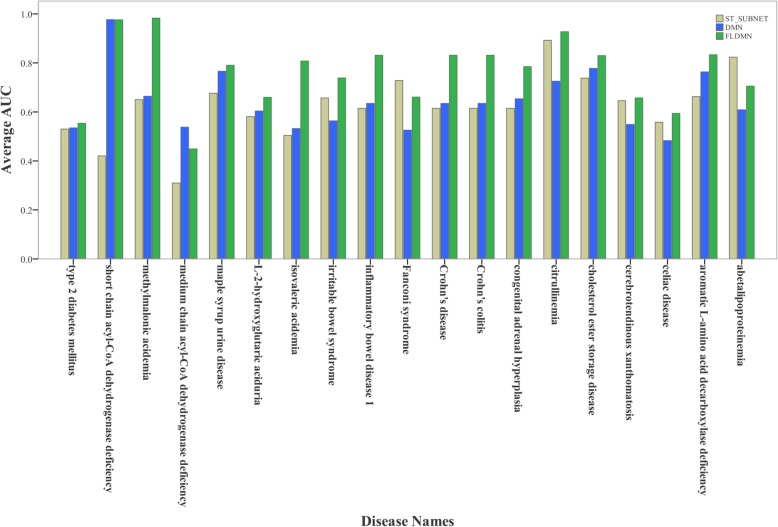
Fig. 5.
Performances of three metabolite networks to predict candidate metabolites related with a given disease. ST_SUBNET, DMN and FLDMN are utilized to predict candidate metabolites for each of these 19 diseases, respectively. For a given disease, the three bars with different colours represent average AUC of the three metabolite networks, correspondingly

