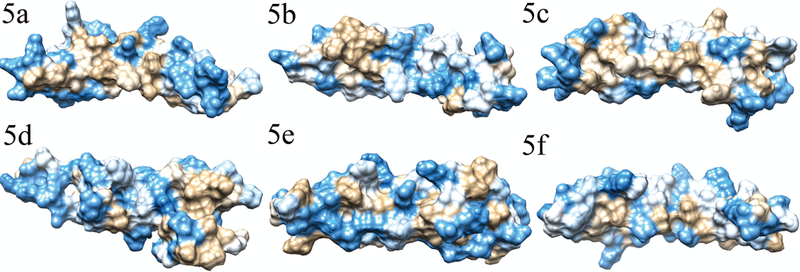
FIGURE 5. Hydrophobicity plot of domains containing hydrophobic patches in THSD7A.

Hydrophobicity plots of domains found to have hydrophobic patches. Blue color indicates hydrophilic regions, tan color indicates hydrophobic regions, and white color indicates regions with average hydrophobicity. Panels 6a (domain 8), 6b (domain 11), and 6c (domain 21) show the hydrophobic patches observed on the side opposite the Trp-ladder, while 6d shows the hydrophobic patch found in domain 14 within the insertion. For purposes of comparison, the sides opposite the Trp-ladder for domains 2 and 15 are shown in panels 6e and 6f.
