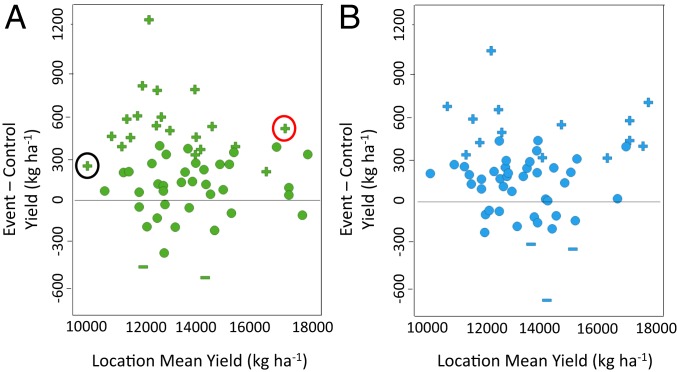
Fig. 2.
The effect of ZmGos2-zmm28 on grain yield measured in multiyear, multilocation field experiments. (A) DP202216 and (B) DP382118 yield differences from WT controls. Each data point represents the difference in yield of the event to the WT control (y axis) across 6 to 12 hybrids relative to the overall yield level of the location (x axis). Plus and minus indicate significantly greater or lower than the control (P < 0.05), respectively, and dot represents no significant difference of the event relative to the control (P < 0.05). The black encircled symbol indicates a significantly positive yield increase of 12 DP202216 hybrids relative to the controls at a low-yielding location. The red encircled symbol indicates a significantly positive yield increase of the same 12 DP202216 hybrids relative to the controls at a high-yielding location.

