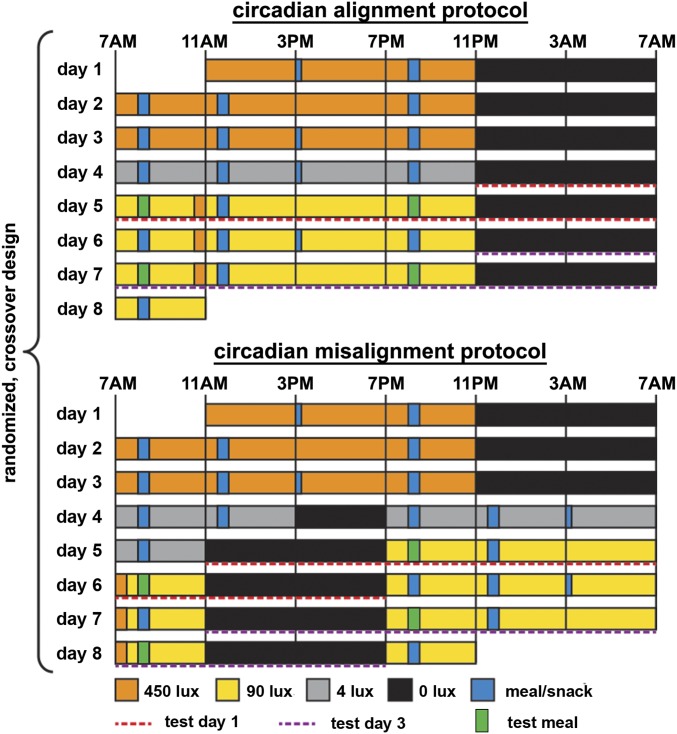
Fig. 1.
Circadian alignment protocol (Top) and circadian misalignment protocol (Bottom) as part of the randomized, cross-over design. Twenty-four-hour metabolic profiles were assessed on days 5 and 7 in the circadian alignment protocol and across days 5/6 and 7/8 in the circadian misalignment protocol (red and purple dashed lines as test day 1 and test day 3, respectively). Light levels indicated are in the horizontal angle of gaze. Green and blue bars represent test meals (green), other meals (wide blue), and snacks (narrow blue).

