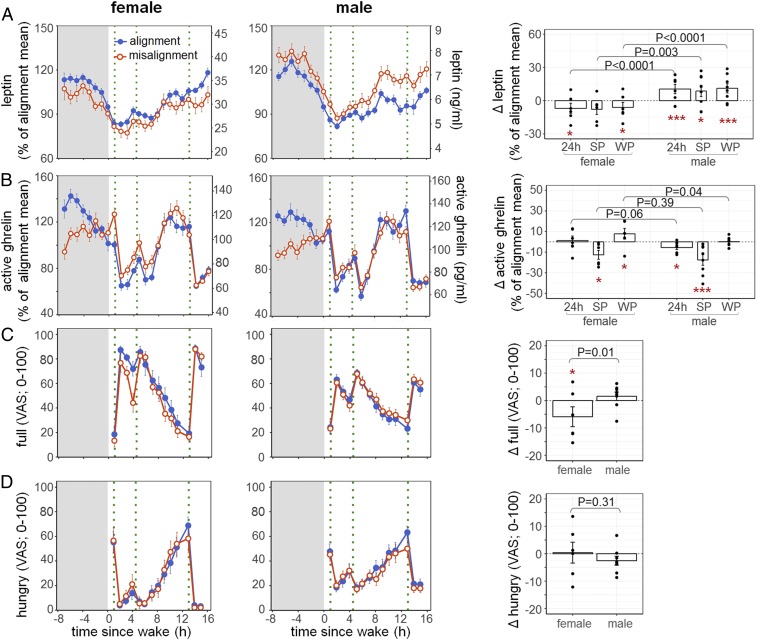
Fig. 2.
Effects of circadian misalignment on leptin (A) and active ghrelin (B) levels and hunger (C) and full (D) ratings in females (Left) and males (Middle). Gray bar represents sleep opportunity; green dotted line represents a meal. Percentage changes (A and B) or absolute changes (C and D) under circadian misalignment as compared to circadian alignment across 24 h or during SP and WP are shown in the bar graphs (Right). As aforementioned, since there were no significant interaction effects of duration of exposure and other main effects, values are reported as both test days combined. Each black dot represents an individual value. P values, statistical significance for interaction effect of misalignment and sex. Adj. P values for subgroup analysis by sex, *adj. P < 0.05; ***adj. P < 0.0001.

