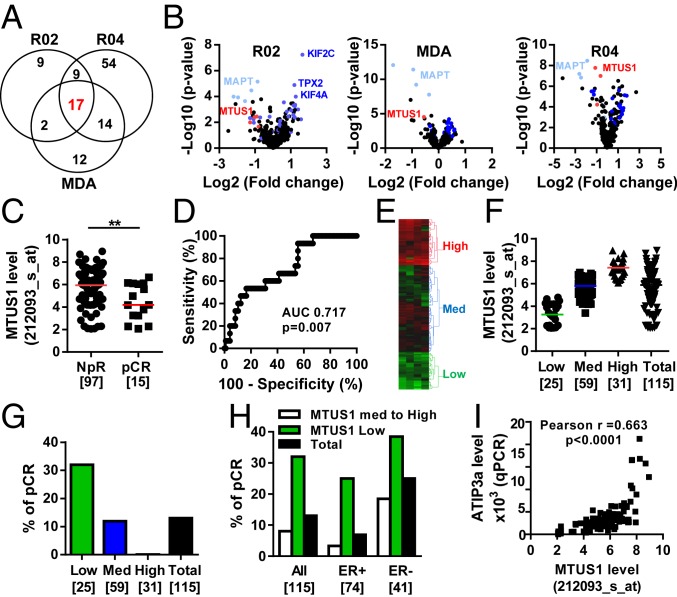
Fig. 1.
Low levels of MTUS1 predict the response to neoadjuvant chemotherapy. (A) Venn diagram of the number of differentially expressed genes between sensitive (pCR) and resistant (NpR) tumors in the REMAGUS02 (R02), REMAGUS04 (R04), and MD Anderson (MDA) cohorts, and common genes among them. (B) Volcano plots showing differentially expressed genes between pCR and NpR tumors from patients of the R02 (Left), MDA (Middle), and R04 (Right) cohorts. Each dot represents the fold change and the P value obtained for a single gene probe set. Genes common to all 3 cohorts are plotted in blue. MAPT is in light blue, and MTUS1 is in red. Names of the best candidates are indicated. (C) Scattered dot plot of the MTUS1 probe set (212093_s_at) intensity in tumors from patients of the R02 cohort with NpR or pCR after neoadjuvant chemotherapy. Numbers of samples are in brackets.**P < 0.01. (D) ROC curve evaluating the performance of MTUS1 expression for predicting complete response to neoadjuvant chemotherapy. (E) Heat map and hierarchical clustering of 115 breast tumor samples based on the intensities of 4 MTUS1 probe sets (212096_s_at, 212093_s_at, 212095_s_at, 239576_at). The heat map illustrates relative expression profiles of MTUS1 (column) for each tumor sample (line) in a continuous color scale from low (green) to high (red) expression. A dendrogram of the 3 selected tumor groups is shown on the right. (F) Scattered dot plot of MTUS1 expression in each of the 3 selected clusters based on the dendrogram shown in E. Numbers of samples are in brackets. (G) Proportion of patients with pCR according to the MTUS1 level in each selected cluster. Numbers of tumors in each group are indicated in brackets. (H) Proportion of patients with pCR according to the MTUS1 level in all tumors (All) and among ER+ and ER- tumors. Numbers of tumors in each group are indicated in brackets. (I) Correlation between MTUS1 (212093_s_at) probe set intensities and ATIP3 mRNA levels measured by real-time RT-PCR (qPCR) using oligonucleotides designed in 5′ exons that are specific to ATIP3 transcripts in 106 breast tumor samples of the R02 cohort.

