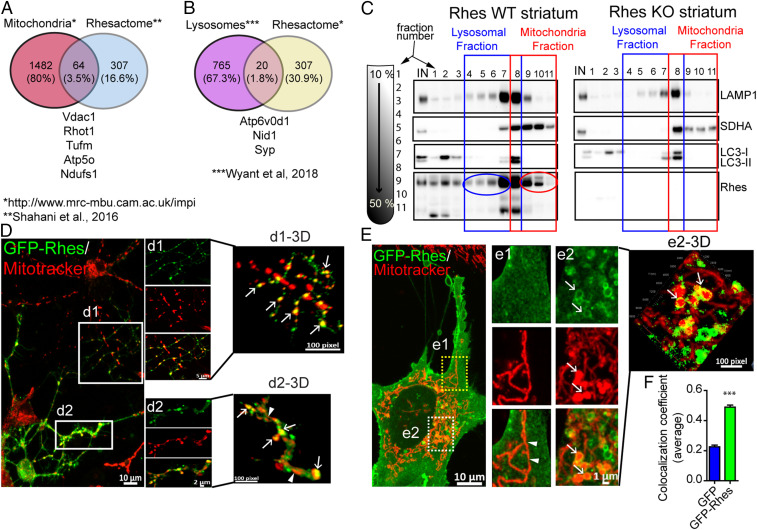
Fig. 1.
Rhes associates with mitochondria and lysosome in vitro and in vivo. (A and B) Venn diagram showing mitochondrial and lysosomal proteins found in Rhes interactome in vivo, “Rhesactome,” compared with available database of mitochondrial and lysosomal proteins (40, 41). (C) Sucrose density gradient and Western blotting of striatal tissue from WT or Rhes KO mice indicating lysosomal (blue) and mitochondrial (red) proteins across different fractions. (D and E) Representative confocal images (their respective Insets or 3D rendered images) of (D) primary striatal neuron and (E) striatal neuronal cells transfected with GFP-Rhes and costained with mitotracker orange (red). Arrow and arrowhead depict globular and elongated mitochondria, respectively, in neuronal processes. (F) Bar graph depicting average Pearson’s coefficient of colocalization (n = 35 to 40 striatal neuronal cells per group, Student’s t test; ***P < 0.001; data are mean ± SEM).

