Fig. 4.
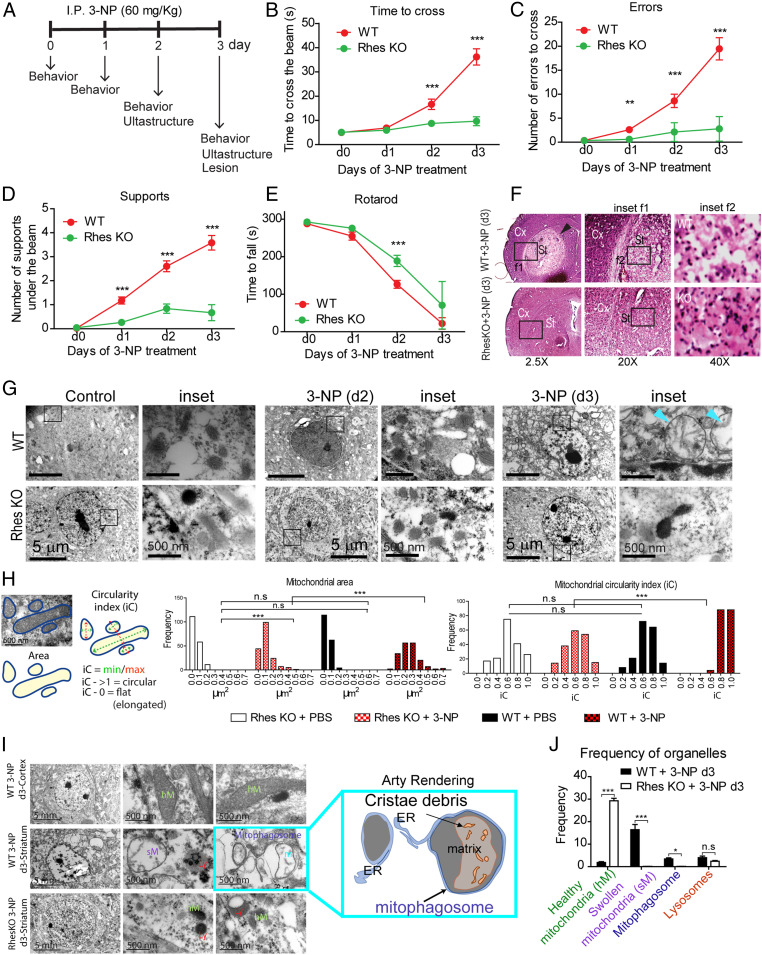
Rhes promotes mitophagy in vivo. (A) Experimental design for 3-NP treatment in mice (I.P.: intraperitoneal injection). (B–D) Beam walk analysis during 3-NP treatment for WT (red circles) and Rhes-KO (green circles) groups. (E) Changes in the latency to fall for the rotarod test during 3-NP treatment. **P < 0.01, ***P < 0.001; 2-way ANOVA followed by Bonferroni’s post hoc test. (F) Representative hematoxylin/eosin-stained sections for WT and Rhes KO mice after 3 d of 3-NP treatment; Cx, cortex; St, striatum. Insets f1 and f2 show the magnified region from the selected area (arrowhead shows the 3-NP striatal lesion). (G) Representative electron micrographs from striatum of WT and Rhes KO mice at day 2 (d2) and day 3 (d3) of 3-NP treatment; Insets are high magnification (blue arrowheads show mitochondria with broken inner membrane). (H) Ultrastructural changes analysis using frequency histograms of the mitochondrial area and circularity index (iC) for the WT and Rhes KO groups treated with vehicle (PBS) or 3-NP. One-way ANOVA (Bartlett’s test), Bonferroni’s post hoc test. ***P < 0.001; n.s, not significant. (I) Representative electron micrographs from striatum and cortex of indicated groups after 3 d of 3-NP treatment. Arty Rendering shows the swollen mitochondria in mitophagosome. (J) Quantification of the healthy and swollen mitochondria, lysosomes, and mitophagosomes frequency in the striatum of WT and Rhes KO mice at day 3 of 3-NP treatment. *P < 0.05, ***P < 0.001, n.s: not significant, determined by 2-way ANOVA, Bonferroni’s post hoc test.

