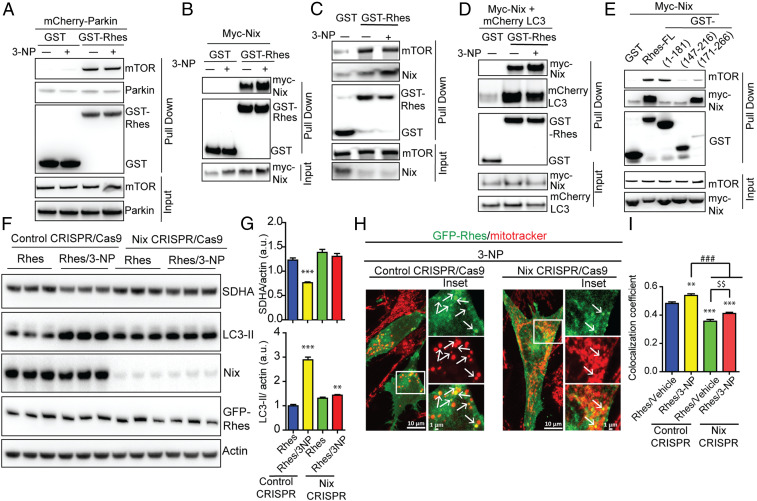
Fig. 6.
Rhes interacts with Nix and promotes mitophagy. (A–E) Representative Western blot of indicated proteins after glutathione affinity purification of HEK 293 cells transfected with GST or GST-Rhes (full length [FL] or fragments), mCherry-Parkin, myc-Nix, or mCherry-LC3 plasmids that are exposed to vehicle or 3-NP (10 mM, 2 h) wherever indicated. Input is 5% of total lysate. (F) Representative Western blot of control or CRISPR/Cas9-mediated Nix-depleted striatal neuronal cells that were transfected with GFP or GFP-Rhes and treated with vehicle or 3-NP (10 mM, 2 h). (G) Bar graph shows the quantification for normalized SDHA and LC3-II proteins. **P < 0.01, ***P < 0.001 vs. Rhes control CRISPR/vehicle (n = 4, data are mean ± SEM; 1-way ANOVA followed by Tukey post hoc test). (H) Representative confocal images and their Insets of control CRISPR/Cas9 or Nix CRISPR/Cas9 striatal neuronal cells transfected with GFP-Rhes and costained for mitotracker (red) that were treated with 3-NP (10 mM for 2 h). Arrows represents the globular mitochondria, positive for GFP-Rhes. (I) Bar graph shows the average of Pearson’s coefficient of colocalization between GFP-Rhes and mitochondria in indicated groups (n = 33 to 37 cells per group; **P < 0.01, ***P < 0.001 vs. Rhes/vehicle control CRISPR; ###P < 0.001, $$P < 0.01 between indicated groups; data are mean ± SEM; 1-way ANOVA followed by Tukey post hoc test).

