Fig. 3.
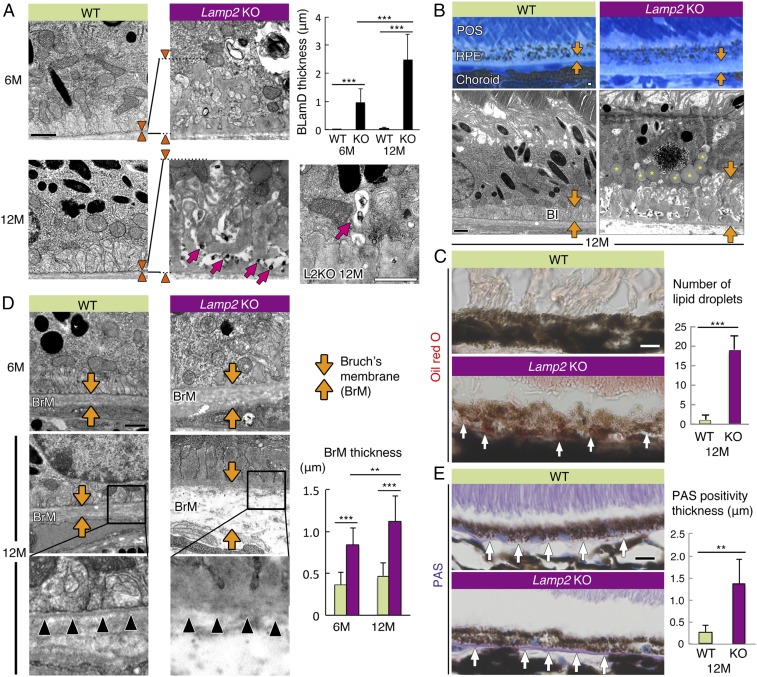
LAMP2 deficiency caused age-dependent accumulation of lipids, basal laminar deposits, and Bruch’s membrane thickening. (A) TEM images of sub-RPE deposit in WT mice and Lamp2 KO mice. Normal basal infolding was observed in WT mice whereas sub-RPE deposit accumulation with age was observed in Lamp2 KO mice. Arrowheads indicate the thickness of BLamDs. The maximum thickness of BLamDs was measured at 6 defined regions per eye. n = 6 mice per group. ***P < 0.001. One-way ANOVA with post hoc Tukey HSD test. Electron-dense granular material was exocytosed into the sub-RPE deposits (arrows in A). (B) Representative images of Azure II stain and TEM of the RPE from 12-mo-old WT or Lamp2 KO mice. Thick BLamDs were detected in aged Lamp2 KO mice in contrast to the normal structure of basal infolding in WT mice (arrows). Note the massive accumulation of lipid droplet–like inclusions in the RPE from aged Lamp2 KO mice (asterisks in image). (C) Oil red O staining in WT and Lamp2 KO mice. (D) TEM images of BrM in WT and Lamp2 KO mice. The maximum thickness of BrM was measured at 6 defined regions per eye. n = 6 mice per group. **P < 0.01, ***P < 0.001. One-way ANOVA with post hoc Tukey HSD test. The basement membrane of the RPE in Lamp2 KO mice was disorganized in contrast to the clearly detectable basement membrane in WT mice (arrowheads). (E) PAS staining under the RPE of WT or Lamp2 KO mice. The number of lipid droplets stained by oil red O and the thickness of PAS positivity were determined at 4 defined regions per eye. n = 6 mice per group. **P < 0.001. Student t test. Values are expressed as mean ± SD. (Scale bars in A, B, and D: 1 μm; in C and E: 10 μm.) BI: basal infolding.

