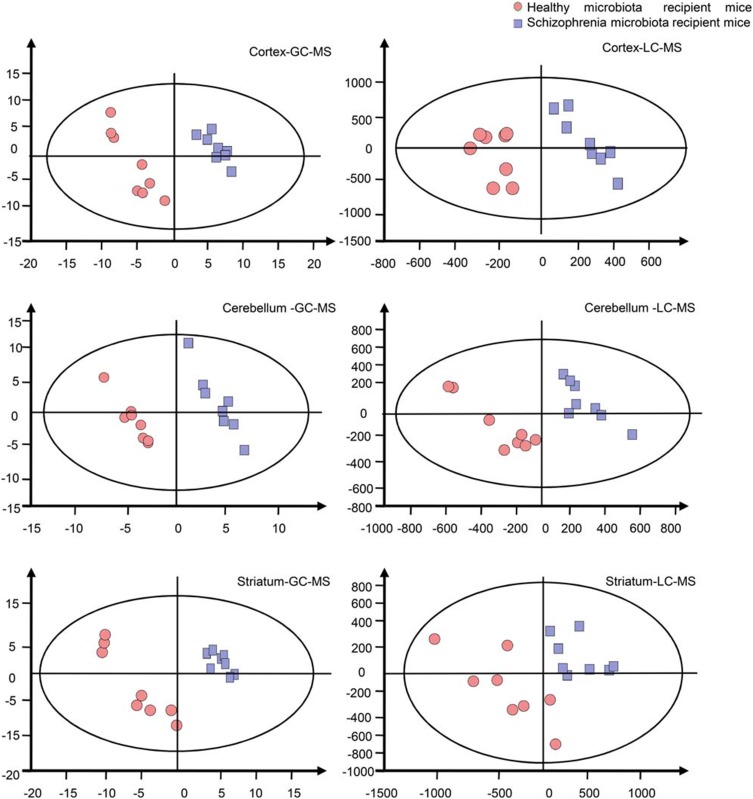
Figure 2.
Metabonomic analysis of brain samples. Partial least-squares discriminant analysis score plots showing clear discrimination between schizophrenia microbiota recipient mice (blue boxes) and healthy microbiota recipient mice (red dots) (n=8 each group) by gas chromatography-mass spectrometry (GC-MS) (cortex: R2Y=0.997, Q2=0.894; cerebellum: R2Y=0.989, Q2=0.578; striatum: R2Y=0.976, Q2=0.881) and liquid chromatography-mass spectrometry (LC-MS) (cortex: R2Y=0.941, Q2=0.15; cerebellum: R2Y=0.953, Q2=0.139; striatum: R2Y=0.963, Q2=0.699).

