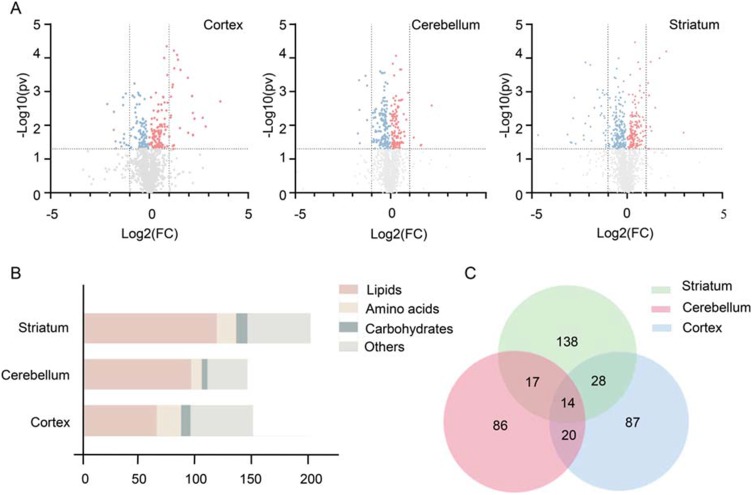
Figure 3.
(A) Volcano plot of metabolites. Metabolites were identified by gas chromatography-mass spectrometry and liquid chromatography-mass spectrometry in the three brain regions. The red dots (up-regulation) and blue dots (down-regulation) represent 213, 255 and 428 metabolites selected from 2415, 2373 and 2416 identified metabolites in the cortex, cerebellum and striatum, respectively (p value < 0.05). (B) Number of differential metabolites. Variables with a VIP score >1 and p value < 0.05 were considered differential variables. In total, 499 differential metabolites were identified in the cortex, cerebellum and striatum. (C) Venn diagram of differential metabolites. The numbers of altered metabolites in the three brain regions in schizophrenia microbiota recipient mice are shown. We found that 14 differential metabolites overlapped among the three brain regions.

