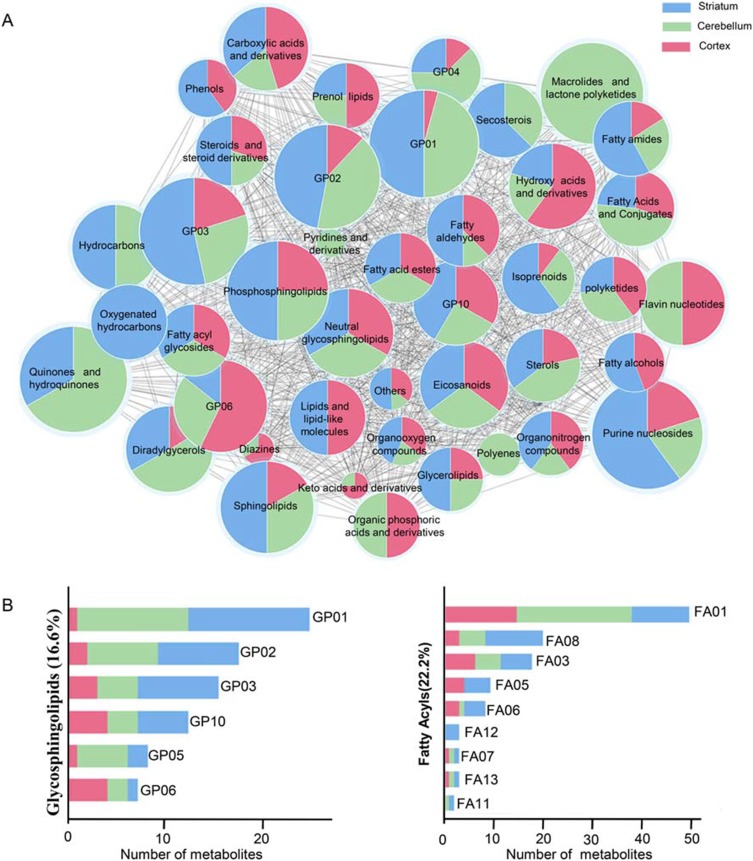
Figure 4.
(A) Intersection metabolic analysis of differential metabolites at the class level. Intersection analysis was displayed by a network of nodes and lines using Cytoscape. The majority of metabolites were evenly distributed in the three regions at the class level. The size of the node represents the relative abundance of metabolites, and the lines represent the correlations between metabolites. (B) Proportion of differential metabolites of fatty acyls and glycerophospholipids in the three brain regions. GP01, Glycerophosphocholines; GP02, Glycerophosphoethanolamines; GP10, Glycerophosphates; GP04, Glycerophosphoglycerols; GP06, Glycerophosphoinositols; GP03, Glycerophosphoserines; FA01, Fatty acids and conjugates; FA08, Fatty amides; FA03, Eicosanoids; FA05, Fatty alcohols; FA06, Fatty aldehydes; FA12, Oxygenated hydrocarbons; FA07, Fatty acid esters; FA13, Fatty acyl glycosides; FA11, Hydrocarbons.

