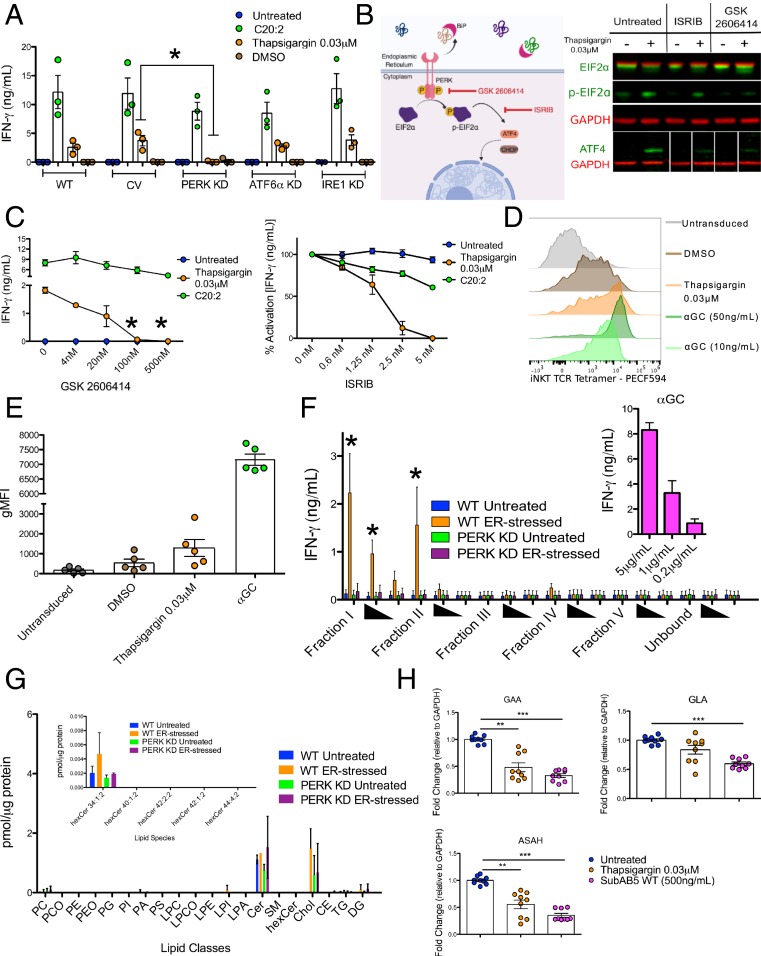
Fig. 2.
Activation of iNKT cells by ER-stressed APCs requires signaling through the PERK pathway to direct CD1d-presentation of immunogenic self-lipid antigens. (A) Wild-type, control vector (CV) and IRE1, ATF6α, or PERK KD vector transduced THP1 wild-type cells were cocultured with human iNKT cells and activation was assessed by IFN-γ secretion. *P < 0.05 by a 1-way ANOVA with a Dunnett’s multiple comparison posttest. IFN-γ secretion is the average of n = 3 biological replicates. (B) An illustration of the mechanism of action of 2 inhibitors of the PERK pathway: The PERK kinase inhibitor GSK 2606414 and the phospho-eIF2α inhibitor ISRIB. Validation of ISRIB and GSK2606414 in blocking PERK signaling via Western blot of THP1 cells after 6 h of treatment. ISRIB blocks PERK signaling events beyond eIF2α phosphorylation (i.e., ATF4 up-regulation). GSK2606414 blocks eIF2α phosphorylation and ATF4 up-regulation (Right). (C) Effect of GSK2606144 (Left) and ISRIB (Right) on iNKT cell activation by thapsigargin-treated THP1 cells. THP1 cells pulsed with C20:2, an analog of αGC that binds surface CD1d molecules were used a control for nonspecific inhibitor toxicity and functional CD1d presentation. *P < 0.05 by a 1-way ANOVA with a Dunnett’s multiple comparison posttest. The starred data points are compared to the thapsigargin condition without inhibitor added. The data points represent the average of n = 3 biological replicates. (D) Representative FACS plots of untransduced THP1 wild-type cells (gray) or thapsigargin-treated THP1-CD1d overexpressing cell stained using a fluorescently labeled, soluble iNKT-TCR tetramer. As a control, THP1-CD1d overexpressing cells were treated with 2 concentrations of αGC. (E) Cumulative data. Each dot of depicts the geometric mean fluorescence intensity of the TCR staining of 1 of n = 5 biological replicates, each performed in technical duplicates. (F) Lipids extracted from untreated or thapsigargin-treated wild-type or PERK KD THP1 cells as described in the methods were pulsed in 3 decreasing concentrations (solid triangles) onto recombinant, plate-bound CD1d molecules and cocultured with human iNKT cells. Activation is measured by IFN-γ secretion. As a control αGC was added to the CD1d-coated plates (Inset). *P < 0.05 by 1-way ANOVA with a Bonferroni posttest comparing ER-stressed wild-type group with the untreated wild-type group IFN-γ secretion is the average of n = 5 biological replicates. (G) The lipid classes and species in fraction I were identified and quantified by shotgun MS. Lipid quantity (in picomoles) was normalized to protein concentration for each sample. (H) Fold-change in transcriptional expression of the enzymes GAA, GLA, and ASAH1 relative to GAPDH in unstressed and ER-stressed MoDCs. Each dot represents 1 of 3 technical replicates for an n = 3 biological replicates. **P < 0.005 and ***P < 0.001 by a Mann–Whitney U test.

