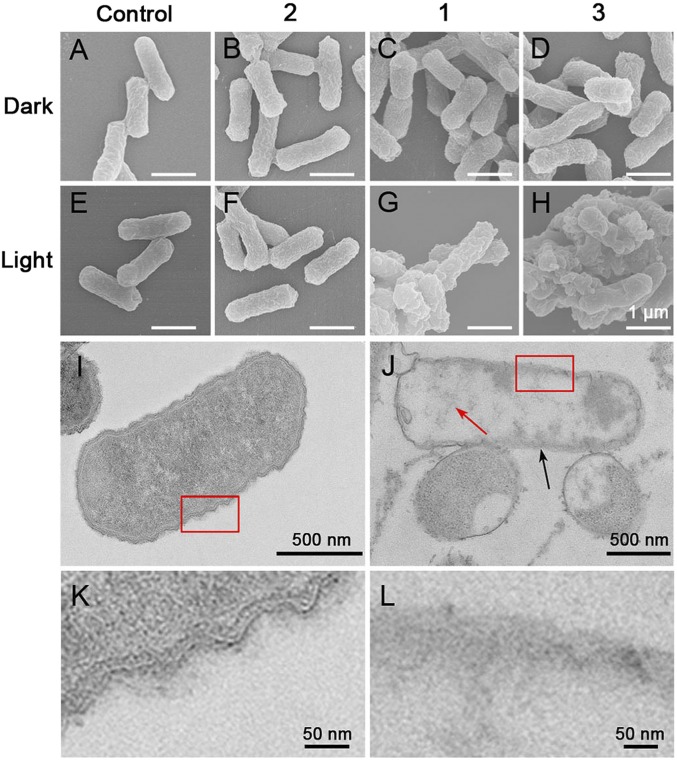
Fig. 7.
(A–H) Representative SEM images of E. coli cells without treatment (A and E) or incubated with protein 2 (B and F), metallacycle 1 (C and G), or assembly 3 (D and H) in the dark (A–D) or with 420-nm light (25 mW/cm2) irradiation for 15 min (E–H). (Scale bars for A–H: 1 μm.) (I and J) TEM section images of E. coli without any treatment in the dark (I) or incubated with assembly 3 with 420-nm light (25 mW/cm2) irradiation for 15 min (J). K and L are enlarged images of the red squares in I and J, respectively.

