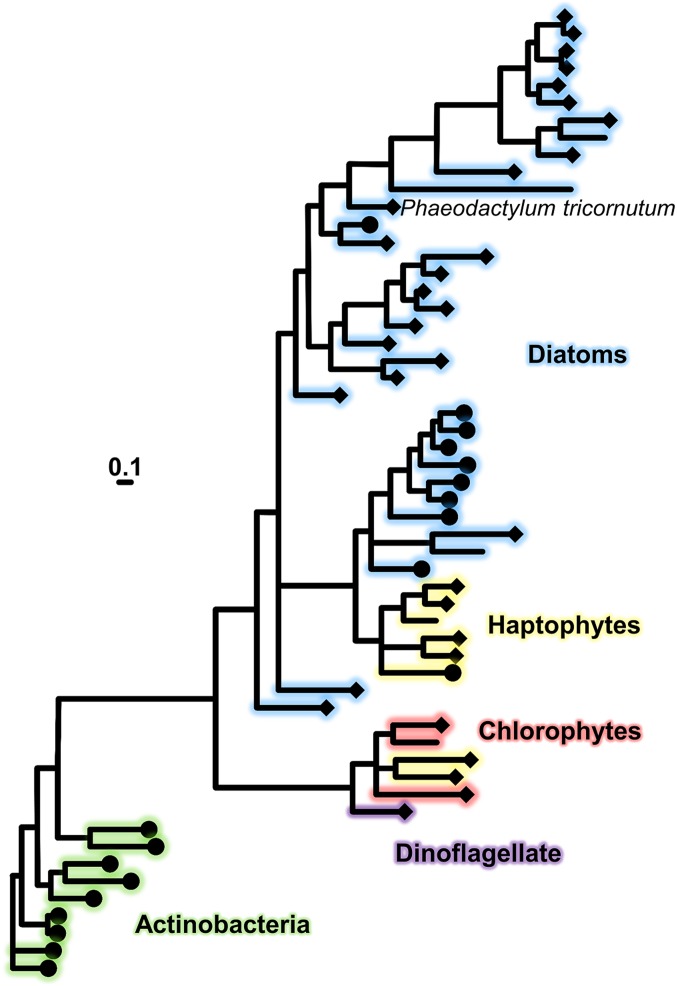
Fig. 6.
Bayesian phylogenetic tree (PhyloBayes 4) as inferred from publically accessible amino acid sequences of FBP1 and related homologs from diatoms, hatophytes, chlorophytes, dinoflagellate, and Actinobacteria. Protein sequences which modeled as ferri-siderophore receptors using Phyre2 are indicated with diamonds, and sequences with additional siderophore binding annotations are indicated by circles. (Scale bar, 0.1 amino acid substitutions per position.) Branch color indicates phylogenetic group. Posterior probabilities indicating the Bayesian support of the tree, maximum-likelihood (LG) boostrap support, and species identification are given in SI Appendix, Fig. S2.

