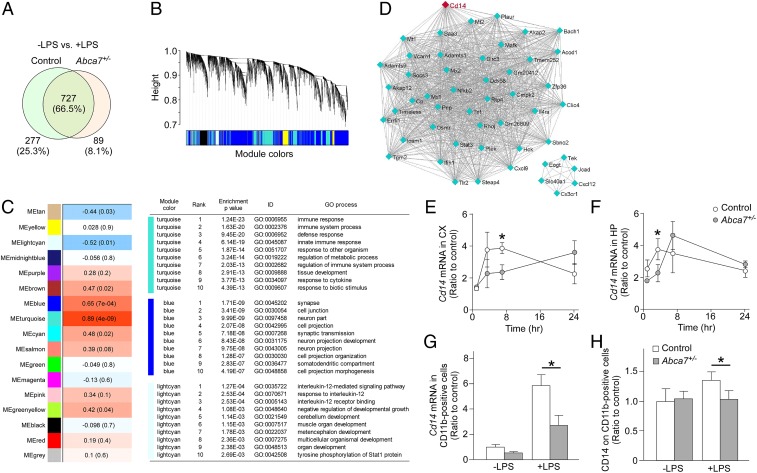
Fig. 3.
Altered cortical transcriptome by ABCA7 haplodeficiency and peripheral LPS stimulation. (A) Venn diagram of cortical genes markedly changed at 3.5 h after LPS administration in control and Abca7+/− mice (n = 6/each) through RNA-seq. (B) Clustering dendrogram of genes displayed with gene dissimilarity based on topological overlap through WGCNA among the 4 groups of mice: control with LPS administration, Abca7+/− with LPS administration, control with LPS administration, and Abca7+/− with LPS administration. Each module is represented by a unique color. (C) The module traits were correlated with the 4 groups of mice. The corresponding correlations and P values are displayed in each module. Modules showing a significant change (P ≤ 0.01) were analyzed for pathway enrichment. (D) Visualization of the gene–gene interaction within the turquoise module. (E–H) Expression levels of Cd14 mRNA were analyzed in the cortex (CX; E) and hippocampus (HP; F) of control (white) and Abca7+/− (gray) mice at 1 h (control, n = 4; Abca7+/−, n = 4), 3.5 h (control, n = 15; Abca7+/−, n = 17), 7 h (control, n = 4; Abca7+/−, n = 4), and 24 h (control, n = 4; Abca7+/−, n = 4) after i.p. LPS injection. (G and H) CD11b-positive microglia were isolated from the cortex at 7 h after administration with or without i.p. LPS injection. Cd14 mRNA (G; control, n = 4; Abca7+/−, n = 4; control with LPS, n = 9; Abca7+/− with LPS, n = 9) and cell surface CD14 (H; control, n = 4; Abca7+/−, n = 4; control with LPS, n = 9; Abca7+/− with LPS, n = 9) levels in the isolated microglia were measured by qRT-PCR and FACS, respectively. For qRT-PCR, the ∆∆Ct values of Cd14 relative to Hprt were measured. Relative ratios to control mice without LPS administration are shown as mean ± SEM. *P < 0.05, Student t test at each time point (E and F) or Tukey–Kramer post hoc analysis of 2-way ANOVA (G and H).

