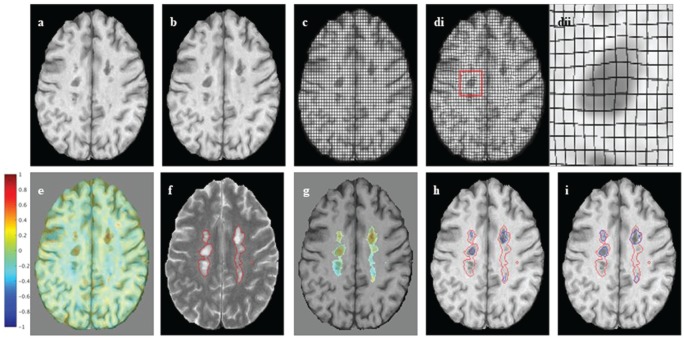
Figure 1.
Jacobian analysis and SEL candidates: (a), (b) An axial slice of linearly co-registered reference and follow-up T1-weighted scans. (c) The reference scan with a regular grid overlaid. (di) The non-linearly deformed image in (c) is shown to match the follow-up scan, and (dii) an enlarged lesion area of the deformation field. (e) The Jacobian determinant is shown as a heat map, where blue represents local contraction and red local expansion. The Jacobian determinant represents the local percent volume change at each voxel, after application of the non-linear deformation that warps (a) to match (b). (f) An axial slice of a reference T2-weighted scan with overlaid T2 lesion segmentation. (g) The Jacobian determinant within reference T2 lesions. (h) Initial SEL candidate boundaries based on JE1. (i) Refined SEL candidate boundaries based on JE2.
JE: Jacobian Expansion; SEL: slowly expanding/evolving lesion.

