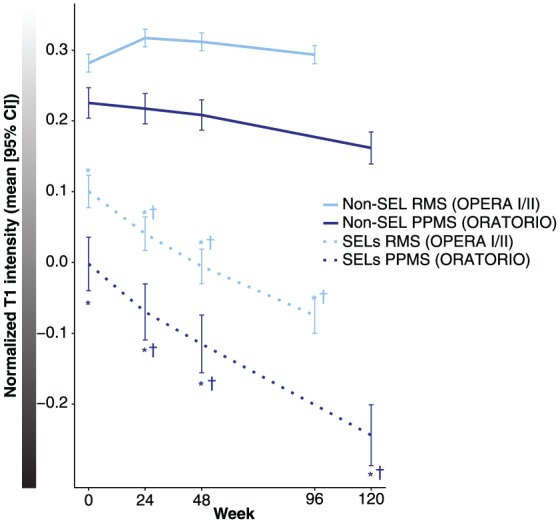
Figure 5.

T1-weighted signal intensity in SELs.
CI: confidence interval; PPMS: primary progressive multiple sclerosis; RMS: relapsing multiple sclerosis; SEL: slowly expanding/evolving lesion.
Last visit is Week 96 for OPERA I and OPERA II, and Week 120 for ORATORIO.
aVan Elteren test; stratified by treatment group (ocrelizumab, control), baseline T2 lesion volume category based on tertiles (⩽3.013 cm3, <3.013 to ⩽11.122 cm3, >11.122 cm3).
*p < 0.001a for the comparison of absolute T1 intensity of SELs versus non-SELs at each timepoint in RMS and PPMS.
†p < 0.001a for the change in normalized T1 intensity from baseline to Week 24, Week 48, and Week 96/120 for SELs versus non-SELs in RMS and PPMS, respectively.
