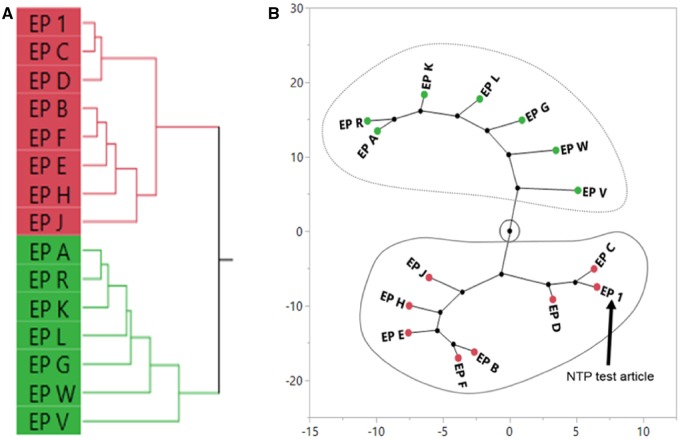
Figure 10.
Sufficient similarity evaluation of Echinacea purpurea (EP) samples using the area under the curve of gene expression concentration-response curves in exposed sandwich-culture primary human hepatocytes. Hierarchical clustering of the area under the curve of gene expression concentration-response curves was done using the Ward’s method (A). A constellation plot (B) was generated from the clustering analysis and EP samples in the same cluster as the NTP test article (EP 1) were determined to be “similar” (circled in solid line). EP samples circled by the dotted line were classified as “different” from EP 1.

