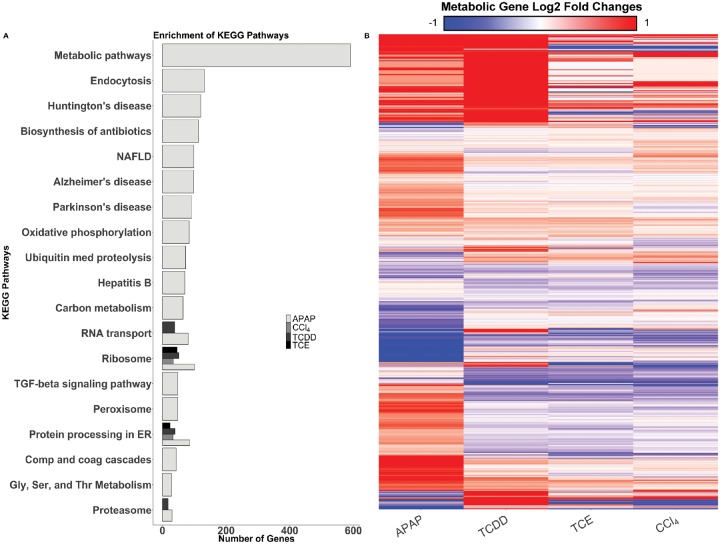
Figure 2.
Gene enrichment and metabolic gene expression data. A, DAVID enrichment of KEGG Pathways for six hours in APAP-, CCl4-, TCDD-, and TCE-induced toxicity conditions. The heat map above shows the log2 fold changes of the metabolic genes from sequencing (B). Each condition is listed on the x-axis, and the individual genes are listed on the y-axis. Genes that are upregulated are shown in red, whereas downregulated genes are shown in blue. Genes on the x-axis are clustered by Euclidean distance, using complete linkage.

