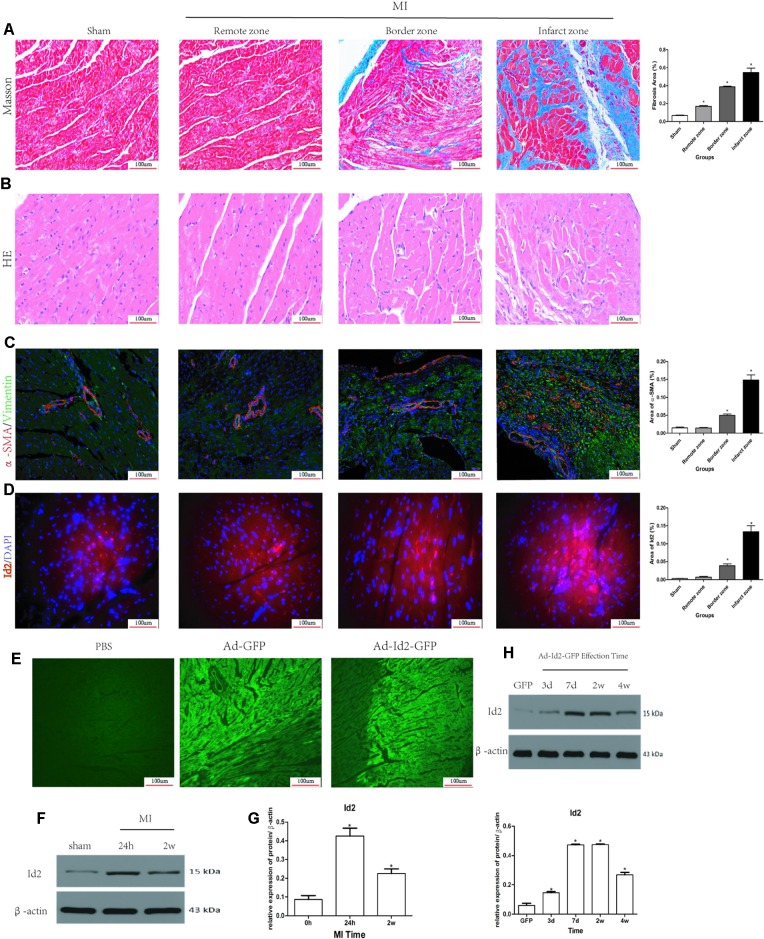
Figure 1.
Myocardial Fibrosis and Id2 expression in rat hearts post-MI. (A) Masson’s trichrome staining post-MI after 2 weeks (n = 6). Blue staining represents fiber tissue. Scale bars represent 100 um. (B) HE staining post-MI after 2 weeks (n = 6). Scale bars represent 100 um. (C) Immunofluorescence images of myofibroblasts derived from CFs (n = 6). Green, vimentin; red, α-SMA; blue, nuclei. Scale bars represent 100 um (n = 6). (D) Immunofluorescence images show Id2 expressions in MI rats and sham rats. Red, Id2; blue, nuclei. Scale bars represent 100 um. (E, F) Id2 protein levels detected by western blot analysis after MI. (G, H) Rats were intramyocardially injected with Ad-GFP-Id2 or Ad-GFP for 3 days, 7 days, 2 weeks and 4 weeks. The fluorescence of Ad-GFP and Ad-GFP-Id2 in injected area of rat heart after transfected 2 weeks (G). The protein levels of Id2 in left ventricular myocardium were examined by Western Blot (H). h, hours; d, days; w, weeks. β-actin was used as the loading control. Data represent means ± SEM (n = 3). *,P < 0.05 VS Sham group, 0 h or GFP group.

