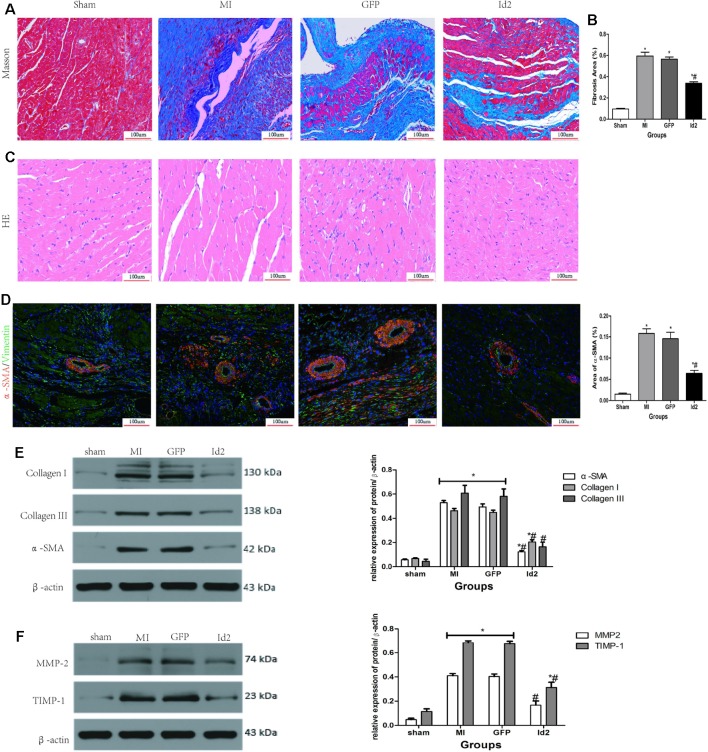
Figure 3.
Adenoviral Id2 delivery ameliorated cardiac remodeling post-MI. (A, B) Representative Masson’s trichrome staining (A) and histogram of connective tissue percentage (B) of hearts. Blue staining indicates connective tissue (n = 6). Scale bars represent 100 um. (C) Representative HE staining images (n = 6). Scale bars indicate 100 um. (D) immunofluorescence images of myofibroblasts derived from CFs (n = 6). Green, vimentin; red, α-SMA; blue, nuclei. Scale bars represent 100 um. (E, F) Western blot analysis of protein expressions in rat hearts among the four groups (n = 3). β-actin was used as the loading control. Data represent means ± SEM. *,P < 0.05, vs sham group; # ,P < 0.05, vs MI group and GFP group;  in panel (E) including α-SMA, Collagen I, Collagen III in both MI and GFP group;
  in panel (E) including MMP2, TIMP-1 in both MI and GFP group.

