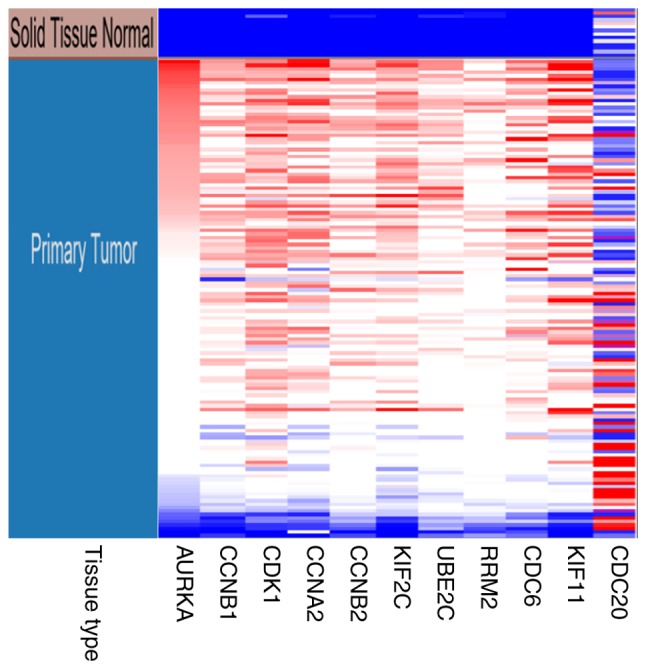
Figure 7.

Hierarchical clustering of hub genes was constructed by University of California Santa Cruz. The samples under the brown bar are non-cancerous samples and the samples under the blue bar are endometrial cancer samples. Upregulated genes are marked in red; downregulated genes are marked in blue.
