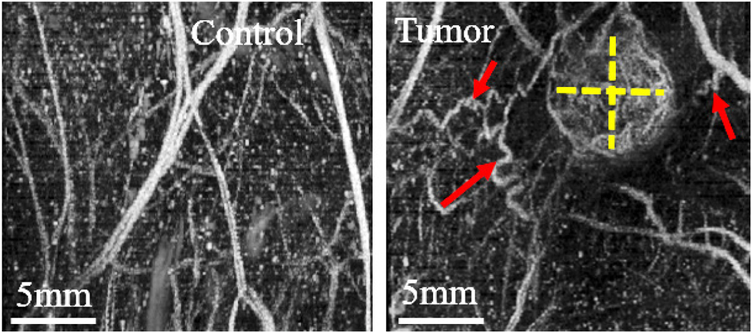
Figure 2.
Example of AA maximum intensity projections of control (left) and tumor-bearing regions (right, tumor size denoted with dashed yellow lines) in a rat fibrosarcoma model. Angiogenesis is clearly seen in the form of tortuous vessels (red arrows) around the periphery of the tumor and high vascular density (VD) in the tumor (more enhanced due to higher contrast agent perfusion). In contrast, control vasculature is generally more linear and directional, as shown.

