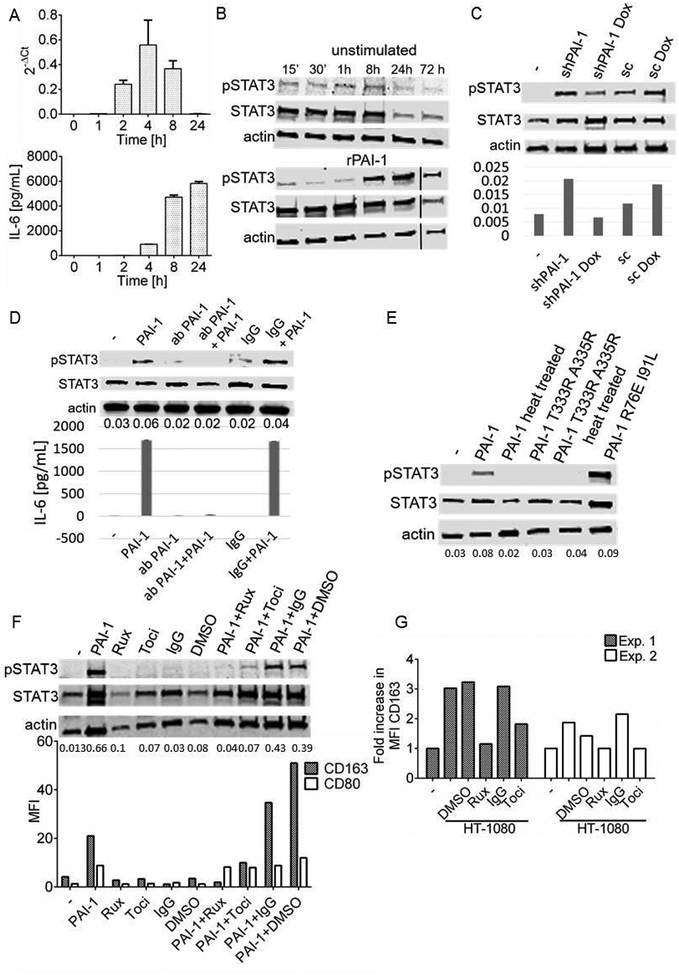
Figure 4. PAI-1-mediated macrophage polarization is IL-6- and STAT3-dependent.
A. Upper panel: IL-6 mRNA expression level measured by qRT-PCR at indicated times in PB monocytes exposed to rPAI-1 (100 nM). The data represent levels normalized against GAPDH analyzed using 2−ΔCt method. Lower panel: corresponding IL-6 protein levels determined by ELISA on aliquots of the medium collected at indicated times. The data represent the mean (± SD) of technical duplicates; B. Western blot analysis of STAT3 phosphorylation in cell lysates of PB monocytes at indicated times after treatment with 40 nM rPAI-1; C. Western blot analysis of STAT3 phosphorylation (Y705) in cell lysates of PB monocytes co-cultured (no-contact) for 3 days with HT1080-Luc-shPAI1 cells in presence and absence of doxycycline. The bar diagram under each lane represents ratio of pSTAT3:STAT3; D. Western blot analysis of STAT3 phosphorylation of PB monocytes exposed to a PAI-1 blocking antibody (5 μg/mL) or isotype antibody and rPAI-1 (40 nM) for 5 h. Lower panel: IL-6 levels measured by ELISA in the medium of PB monocytes treated as indicated in the top panel. The data represent the mean IL-6 concentrations (± SD) of technical duplicates; E. Western blot analysis of STAT3 phosphorylation in lysates from PB monocytes cultured for 4 days in the presence of rPAI-1 and rPAI-1 mutants (40 nM). When indicated, rPAI-1 was heated for 60 min at 95°C. The numbers under each lane represent ratio of pSTAT3:STAT3; F. Western blot analysis of STAT3 phosphorylation in lysates of PB monocytes obtained after 6 days of treatment with rPAI-1 (40 nM), ruxolitinib (1 μM), tocilizumab (20 μg/mL), IgG (20 μg/mL) or DMSO or their combination. The numbers under each lane represent ratio of pSTAT3:STAT3. Lower panel: corresponding CD163 MFIs of PB monocytes treated as indicated in the upper panel. The data from an independent biological replicate of this experiment is shown in Figure S3; G. CD163 MFIs in PB monocytes after 3 days in no-contact co-cultures with HT1080 cells in the presence of DMSO, IgG, ruxolitinib or tocilizumab. The data represent the mean values of 2 independent experiments. Tests of difference in means between groups comprising independent, non-matched observations were based on analysis of variance.

