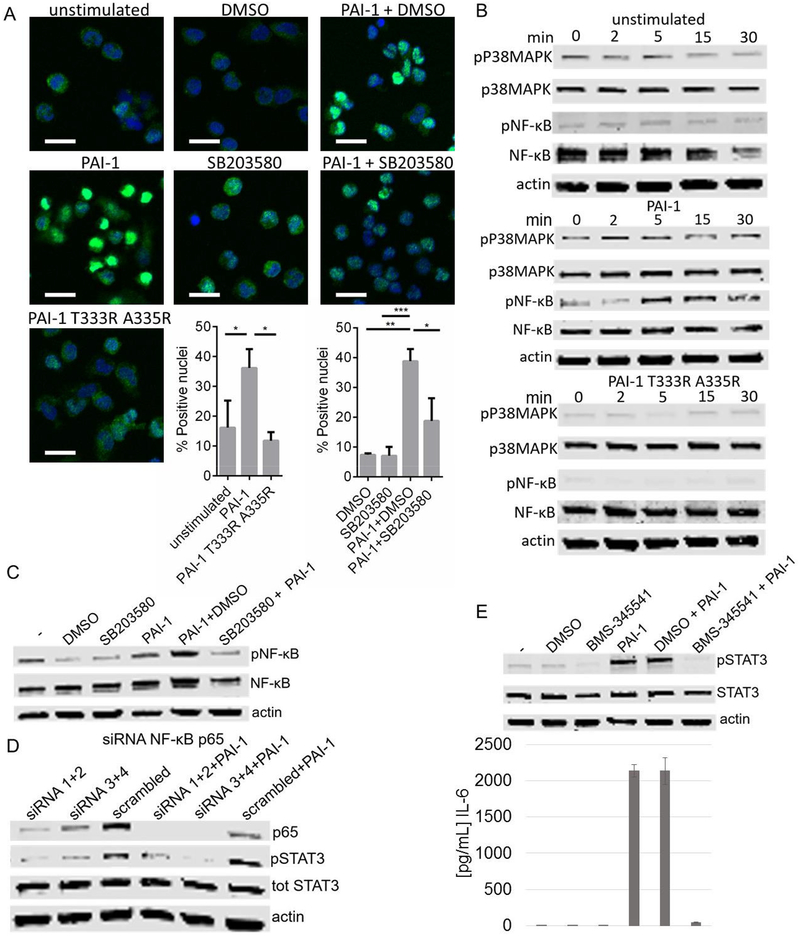
Figure 6. Induction of IL-6 by p38MAPK is NF-κB dependent.
A. Immunofluorescence (IF) analysis of PB monocytes treated with 100 nM rPAI-1 and rPAI-1 T333R A335R for 2 h. When indicated PB monocytes were preincubated with SB203580 (20 μM) for 1 h (or DMSO as a control) and treated with rPAI-1 for 2 h. Cells were analyzed by confocal microscopy for NF-κB. NF-κB: green, DAPI: blue. Scale bar: 20 μm. The histogram represents the mean (± SD) % of nuclei staining positive for NF- κB from a total of 450 nuclei per sample in triplicate (*p<0.05; **p<0.01; ***p<0.001). B. Western blot analysis of p38MAPK and NF-κB p65 and their phosphorylated forms in lysates of PB monocytes exposed to 100 nM rPAI-1 or rPAI-1 T333R A335R for the indicated amount of time; C. Western blot analysis of NF-κB p65 and its phosphorylated form in lysates of PB monocytes exposed for 7 h to rPAI-1, DMSO or SB203580 alone or indicated combinations; D. Western blot analysis of p65 NF-κB, and STAT3 and its phosphorylated form in lysates of PB monocytes in which p65 was downregulated with siRNA and exposed for 7 h to 100 nM rPAI-1; E. Top panel: western blot analysis of STAT3 and its phosphorylated form in lysates of PB monocytes exposed for 7 h to rPAI-1, DMSO, BMS-345541 (5 μM; 1 h pre-incubation) or their combination. Lower panel: IL-6 levels in the medium of PB monocytes treated as indicated in the top panel. The data represent the mean concentrations (± SD) of technical duplicates.

