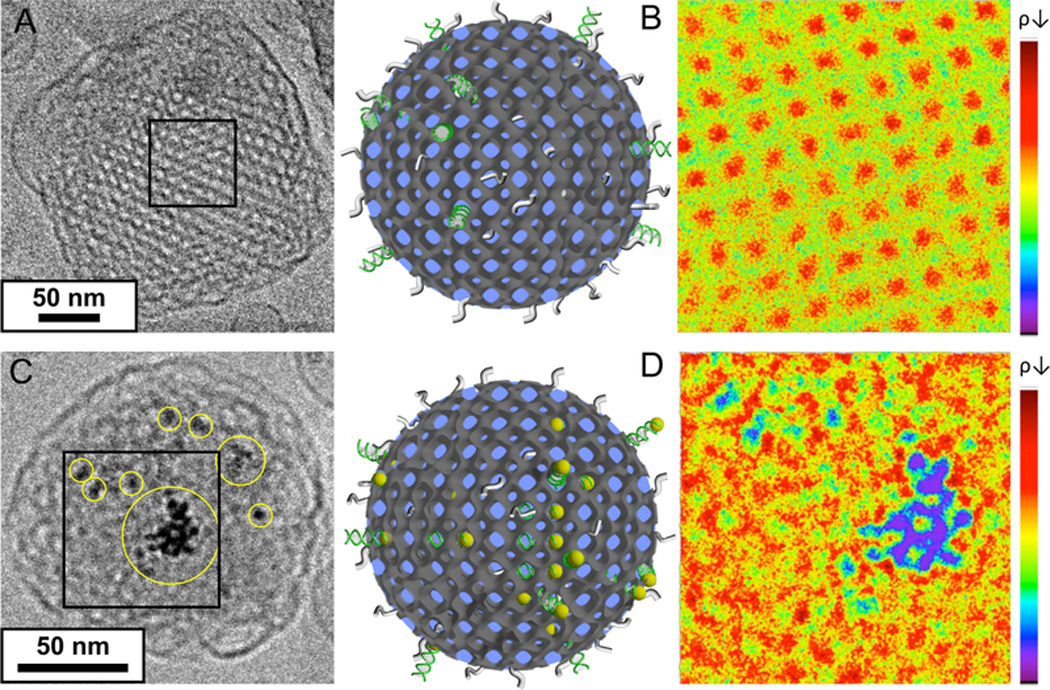
Figure 4.

siRNA loading. (A, C) Cryo-EM images of GMO/DOTAP/GMOPEG (97/2/1, mole ratio) cubosomes having (A) siRNA and (C) siRNA-AuNP conjugates. siRNA-AuNP conjugates provide much higher contrast to locate siRNA molecules within the cubosomes. (B, D) 2D electron density maps of selected boxes (70 nm × 70 nm) shown in A and C. The relative electron density contrast achieved from Cryo-EM images was converted into a color scale shown on the right (red for low and blue for high electron density). In B, the well-ordered lipid membrane (green color) is forming a square lattice aligned in the [100] direction. The red color in the map represents less electron dense regions, the water channels. On the other hand, D shows additional blue and purple regions (high electron density) corresponding to AuNP locations and hence the approximate siRNA location. This is a direct proof of siRNA incorporation into a cubosome. Schematics of cuboplexes are also shown in the middle of the figure. The dark gray, green, gray, and yellow colors represent lipid membrane, siRNA, polyethylene glycol moieties, and gold nanoparticles, respectively.
