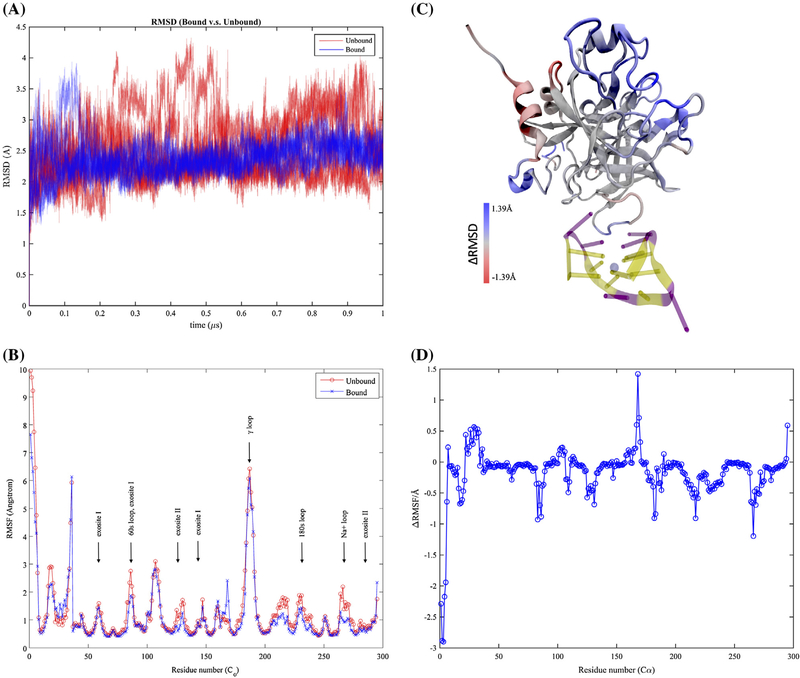
Figure 2.
Thermodynamic fluctuations of thrombin. Free thrombin has heavier fluctuations in comparison with aptamer-bound thrombin with respect to (A) the root-mean-square distances (RMSD) to the same reference of the initial structure along simulation trajectories and (B) the root-mean-squared fluctuations (RMSF) of each alpha carbon atom. The regions with distinct fluctuations on free and aptamer-bound thrombin were also indicated by the colored regions in plot (C). The aptamer-bound thrombin has larger fluctuations in red regions and smaller fluctuations in blue regions. These fluctuation differences were further indicated via the plot of RMSF differences between aptamer-bound and aptamer-unbound thrombin in (D).

