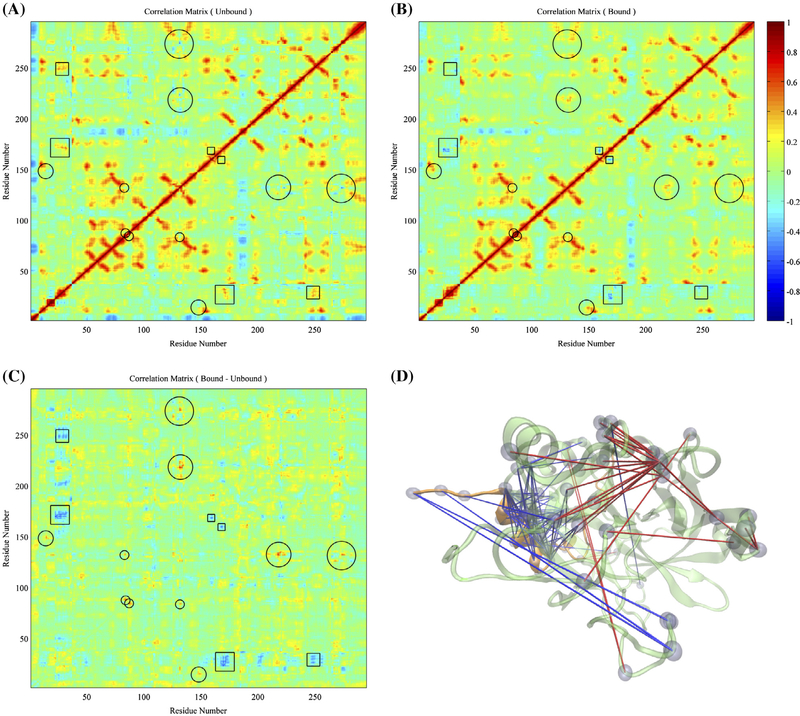
Figure 3.

Comparisons on overall motions between the aptamer-unbound and aptamer-bound thrombin. (A) Correlations of each alpha carbon’s displacement from average position of the free thrombin. (B) Correlations of motions of each alpha carbon’s displacement from average position of the aptamer-bound thrombin. (C) Subtraction of correlation matrix of free thrombin from the one of aptamer-bound thrombin. The circles and squares highlight the regions with significant positive and negative increments of correlations, respectively. (D) Pairs of residues with significantly distinct correlated motions in both systems were highlighted via lines and beads. The blue and red lines indicate residue pairs with negative and positive subtractions of correlation matrices of aptamer-bound and aptamer-unbound thrombin respectively.
