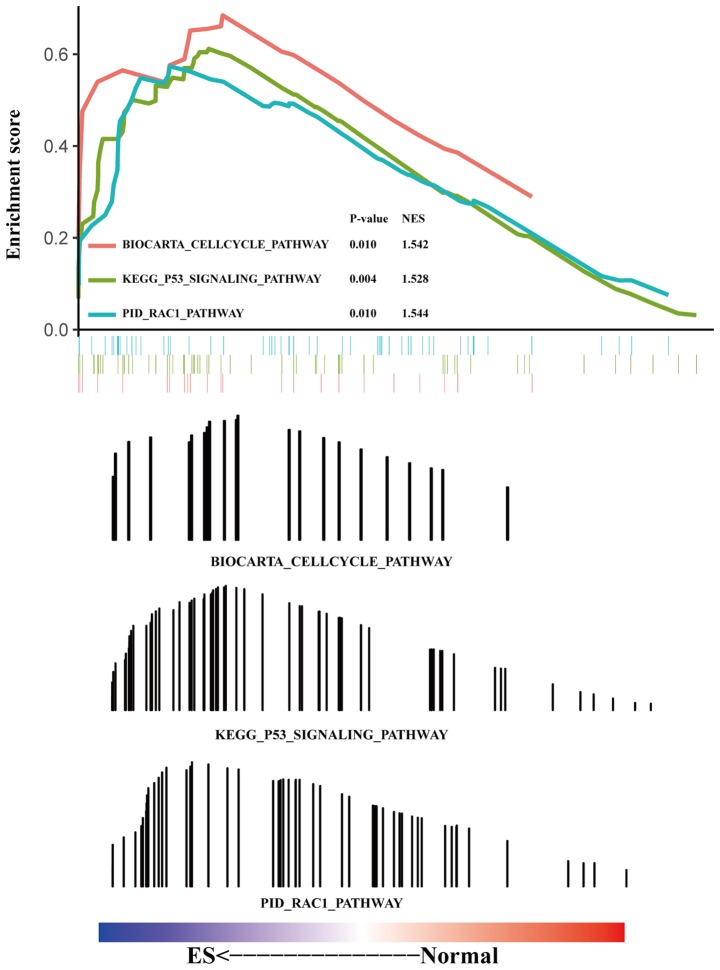
Figure 3.
Gene Set Enrichment Analysis results. The red line represents the cell cycle pathway, the cyan line represents the P53 signaling pathway, and the blue line represents the Rac1 pathway. NES, Normalized Enrichment Score; KEGG, Kyoto Encyclopedia of Genes and Genomes; ES, Ewing's sarcoma; PID, the Pathway Interaction Database.

