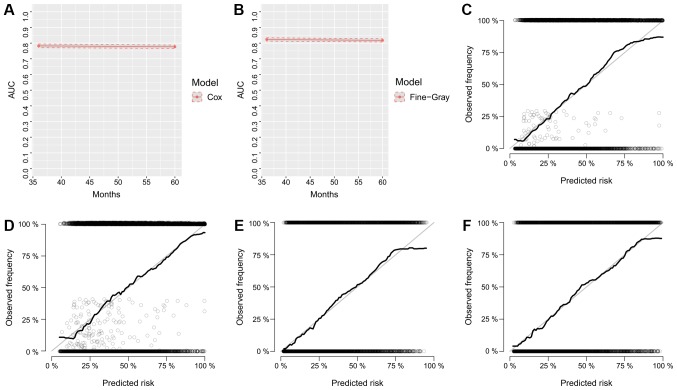
Figure 5.
Calibration curves and AUC plots. Calibration for internal validation of Cox-based and SH based nomograms. Time-dependent AUC plots of (A) Cox-based and (B) SH-based nomograms. Calibration plots for 3-year (C) and 5-year (D) Cox-based nomograms. Calibration plots for 3-year (E) and 5-year (F) SH-based nomograms. AUC, area under the curve; SH, subdistribution hazard.

