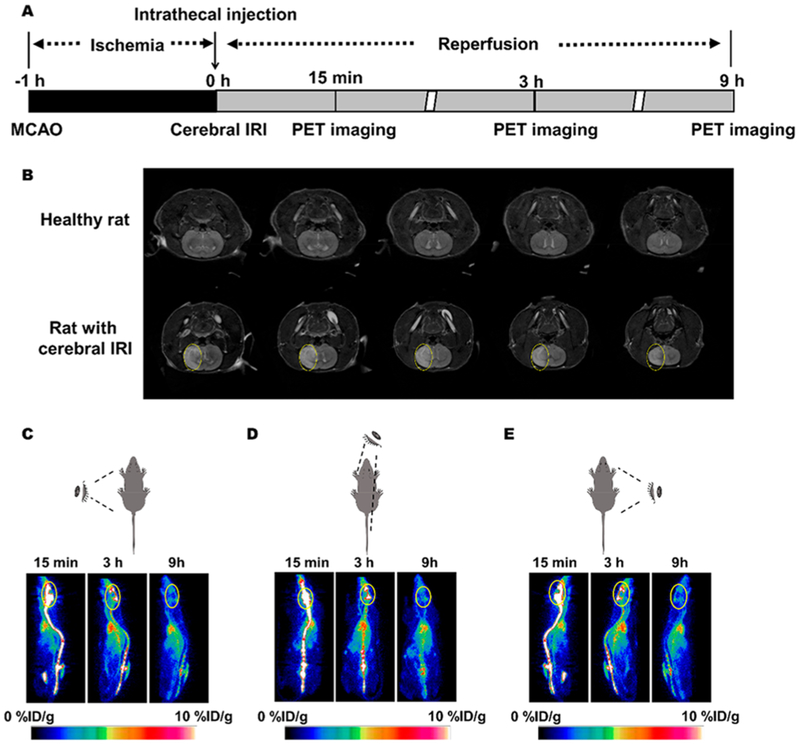
Figure 3.
PET imaging of aC5a-FNA in rats with cerebral IRI. (A) Time schedule of cerebral IRI model establishment, treatment, and PET imaging using aC5a-FNA. (B)T2-weighted magnetic resonance image of rats at 3 days after IRI. The white area represents the lesion (marked by yellow circle). Representative longitudinal PET images of 89Zr-labeled aC5a-FNA from (C) the left, (D) top, and (E) right view. Yellow circles denote the brain.

