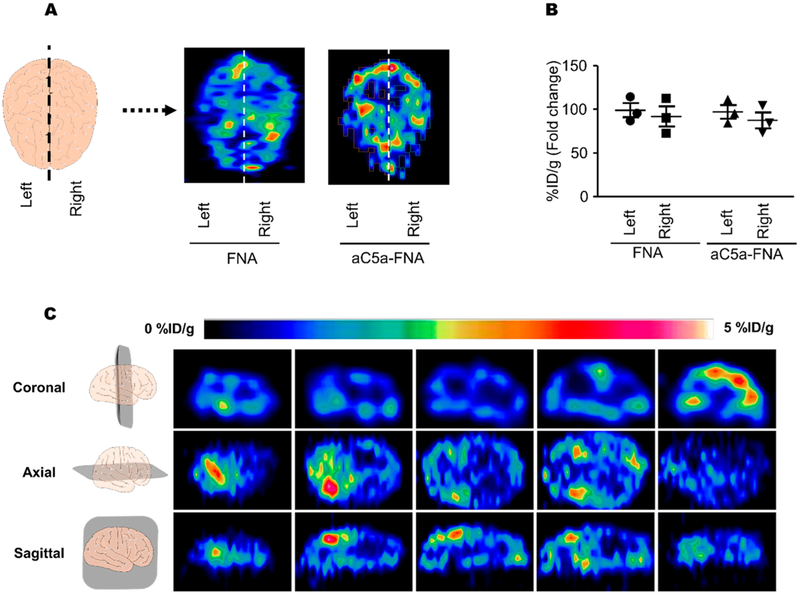
Figure 4.
The biodistribution of FNA in the brains of rats with cerebral IRI. (A) Representative PET images of both the FNA and aC5a-FNA in the brain at 3 h after IRI. (B) Quantitative analysis of FNA in the left and right side of the brain. Data represent mean ± SD from three independent replicates. (C) Representative sections of PET images of 89Zr-labeled aC5a-FNA were shown at 3 h after cerebral IRI.

