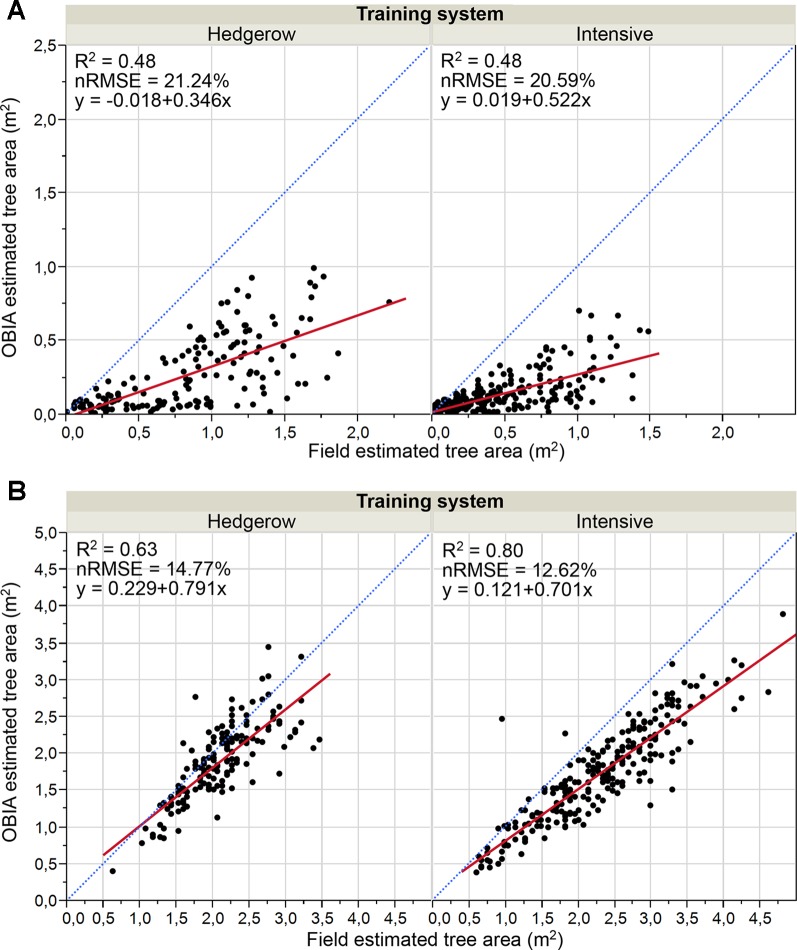
Figure 8.
Graphical comparisons of Point cloud-OBIA estimated and field estimated crown area by training system in: (A) January 2017, 15 months after olive plantation; (B) January 2018, 27 months after olive plantation. The normalized root mean square error (nRMSE) and coefficient of determination (R2) derived from the regression fit are included for every scenario (p 0.0001). nRMSE was computed as the percentage of the average of measured values of tree variables. The red solid line is the fitted linear function and the blue dashed line represents the 1:1 line.

