Fig. 6.
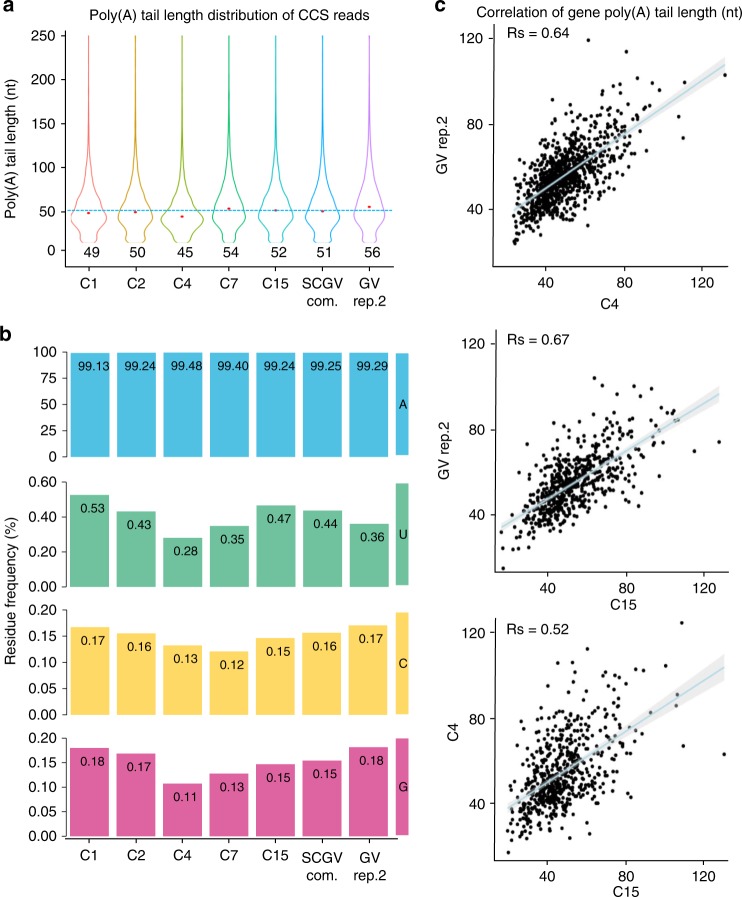
Single-cell PAIso−seq for GV oocytes. a Global poly(A) tail length distributions of all detected CCS reads (Pass ≥10) in single GV oocyte C1 (cell 1), C2, C4, C7, C15, and GV rep.2, and single GV oocyte-combined (SCGV com.) datasets. The median length of each poly(A) tail of a transcript is shown as the red dot and the number below the violin plot. b The frequency of non-A residues in single GV oocytes C1, C2, C4, C7, C15, GV rep.2, and SCGV com. datasets. c The Spearman’s correlation of gene poly(A) tail length between single GV oocyte C4 and GV rep.2 (top panel, n = 928), single GV oocyte C15 and GV rep.2 (middle panel, n = 566), single GV oocyte C15 and C4 datasets (bottom panel, n = 597) datasets. The blue line represents linear regression line. The light-gray area represents confidence interval of the regression. Genes with at least four transcripts in each of the datasets are included in the analysis.

