Fig. 2.
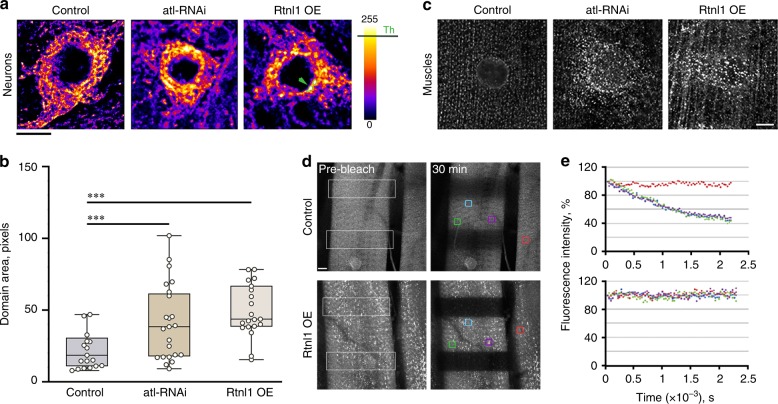
Rtnl1 overexpression and loss of atlastin give rise to comparable defects in ER distribution and connectedness. a Deconvolved confocal STED projections showing comparable changes in the ER network appearance produced by Rtnl1 overexpression (Rtnl1 OE) and knockdown of atlastin (atl-RNAi) in Drosophila neurons labeled with the ER marker GFP-KDEL. The pseudo-color representation highlights emergence of bright fluorescent domains (examples marked by the arrow) in Rtnl1 overexpression and atl-RNAi. Scale bar 5 μm. b Rtnl1 overexpression and atl-RNAi show an increase of the total area of bright fluorescent domains (calculated using non-deconvolved STED projections with the brightness threshold Th = 200 indicated in (a)). Five randomly selected cells (total of 20 domains) were analyzed for each condition. Statistical significance: unpaired two-tailed t test, ***p < 0.001. Boxplots show IQR, whiskers indicate minimum and maximum of the dataset. c Emergence of bright fluorescent punctae in third instar larva muscle labeled by GFP-KDEL upon Rtnl1 overexpression or atl-RNAi. Scale bar 10 μm. d Representative images of FLIP performed by repetitive photobleaching of two regions (white outline box) in control and Rtnl1 overexpressing Drosophila larva muscles labeled with GFP-KDEL (left). Scale bar 10 μm. e Rates of fluorescence loss in four independent regions (color boxes) of control (top) and Rtnl1 overexpressing (bottom) muscle were quantified and graphed. The red box was chosen on an adjacent unbleached muscle as a control. Source data are provided as a Source Data file.

